
Shopify Analytics Dashboard with personalized AI insightsTasbid Rahman
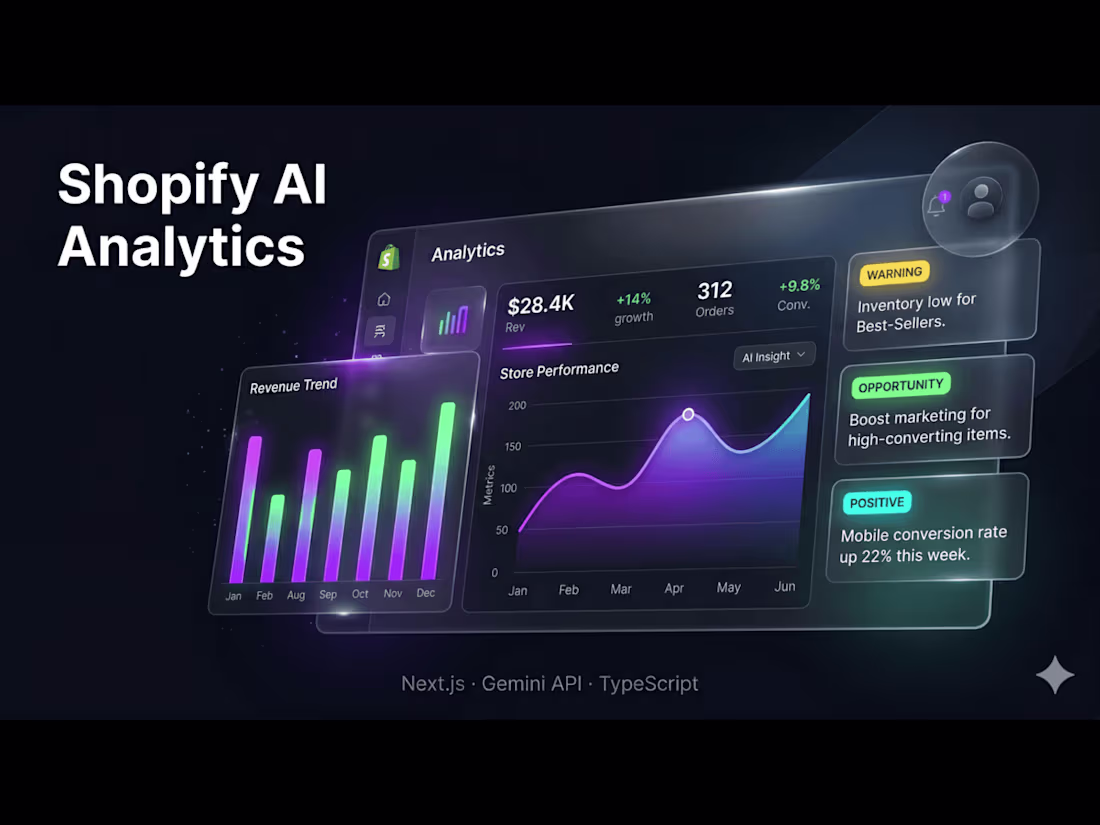
I build a custom AI-powered analytics dashboard where you upload your orders CSV and instantly see everything revenue trends, top products, customer behavior, inventory health, and AI-generated insights. No login. No backend. No subscriptions. Just your data, visualized instantly in a clean interface.
Whats Included:
Core Charts
Revenue by Month gradient bar chart of sales performance
Top Products toggle between revenue and units sold
Revenue by Country top 10 markets breakdown
Orders Over Time daily/weekly trends across 53 weeks
KPI Row revenue, orders, AOV, unique customers
AI-Powered Features
AI Insights Panel Gemini API generates 5 actionable insights (Warning, Positive, Opportunity)
Revenue Forecast next-month prediction using linear regression with R² confidence
Advanced Analytics
RFM Segmentation Champions, Loyal, At Risk, Lost, New
Inventory Alerts Low Stock, Fast Moving, Stable, Declining
Cohort Retention Heatmap tracks returning customers over time
Tech Stack Next.js 14 · TypeScript · Recharts · Tailwind CSS · Gemini API · Papaparse · Vercel
FAQs
Contact for pricing
Duration1 week
Tags
Shopify
Dashboard
Data Analyst
Analytics
AI Insight
Service provided by
Tasbid Rahman Dhaka, Bangladesh
Shopify Analytics Dashboard with personalized AI insightsTasbid Rahman
Contact for pricing
Duration1 week
Tags
Shopify
Dashboard
Data Analyst
Analytics
AI Insight
I build a custom AI-powered analytics dashboard where you upload your orders CSV and instantly see everything revenue trends, top products, customer behavior, inventory health, and AI-generated insights. No login. No backend. No subscriptions. Just your data, visualized instantly in a clean interface.
Whats Included:
Core Charts
Revenue by Month gradient bar chart of sales performance
Top Products toggle between revenue and units sold
Revenue by Country top 10 markets breakdown
Orders Over Time daily/weekly trends across 53 weeks
KPI Row revenue, orders, AOV, unique customers
AI-Powered Features
AI Insights Panel Gemini API generates 5 actionable insights (Warning, Positive, Opportunity)
Revenue Forecast next-month prediction using linear regression with R² confidence
Advanced Analytics
RFM Segmentation Champions, Loyal, At Risk, Lost, New
Inventory Alerts Low Stock, Fast Moving, Stable, Declining
Cohort Retention Heatmap tracks returning customers over time
Tech Stack Next.js 14 · TypeScript · Recharts · Tailwind CSS · Gemini API · Papaparse · Vercel
FAQs
Contact for pricing