
Report, deck or dashboard from your raw dataEugene Panchenko
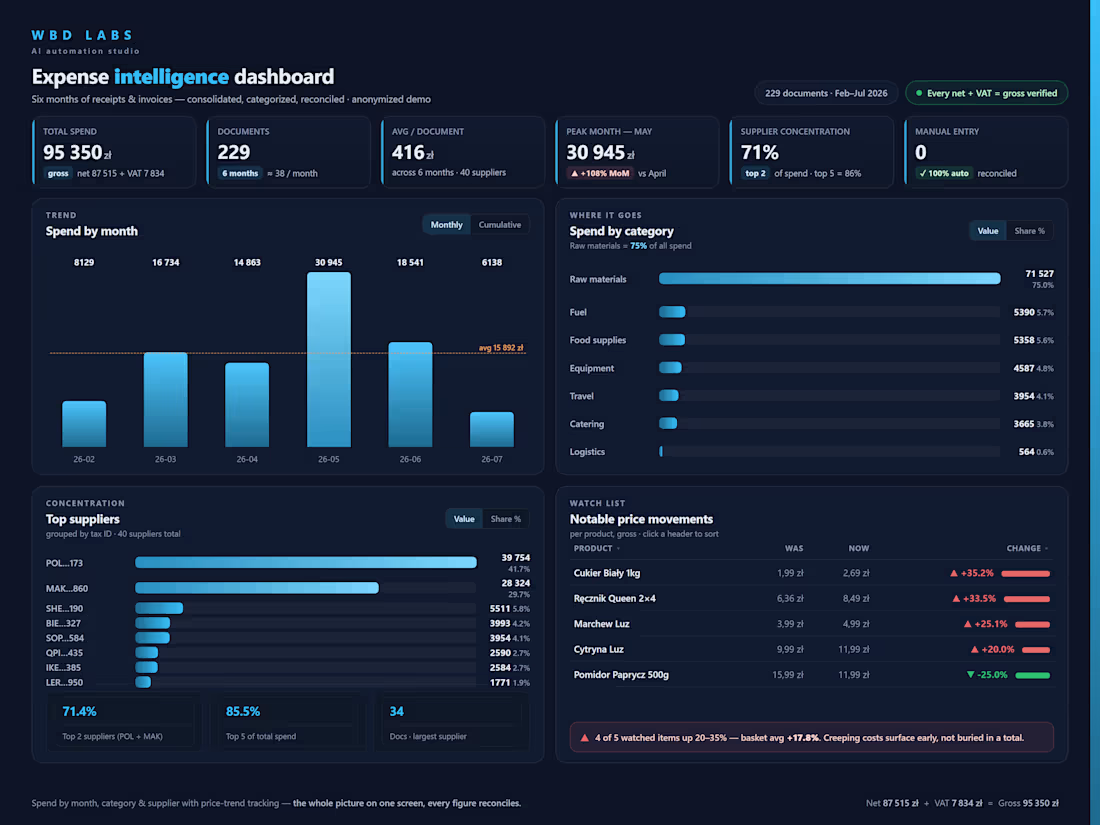
You already have the data — in spreadsheets, exports or a pile of CSVs. What you don't have is a clear picture you can act on or show to others.
I turn your raw data into a clean, branded report or dashboard: the numbers rolled up, cross-checked, and laid out so the story is obvious at a glance.
What you get:
• Your data cleaned and consolidated — duplicates and mismatches caught, not carried through.
• Roll-ups that matter: by month, category, supplier, product or region — your call.
• Clear charts and tables, on-brand and ready to share.
• A short written read-out: what the numbers say and what to do next.
• Delivered as a polished PDF and/or an interactive Excel dashboard.
Packages:
• Single View ($100, 3 days) — one source file, ~2,000 rows, one report or dashboard view, up to 5 charts or tables, branded PDF.
• Report + Interactive Dashboard ($175, 5 days) — up to 3 files, ~25,000 rows, consolidated and reconciled, 3 views, interactive Excel plus a written read-out.
• Recurring Reporting Pack ($400, 10 days) — everything above plus 5 views, a reusable monthly template, automatic consistency checks, a 30-minute walkthrough and a month of support.
Why it's reliable: figures are reconciled before they're charted — in a live 6-month deployment my pipeline reconciled 484 records and auto-caught 75 mismatches. You present numbers you can trust.
Send a sample of your data and I'll show you the layout that fits.
FAQs
Example work



Starting at$100
Duration3 days
Tags
Microsoft Excel

Data Analyst
Presentation Designer
Business Intelligence
Dashboards
Data Visualisation
Service provided by
Eugene Panchenko Warsaw, Poland
Report, deck or dashboard from your raw dataEugene Panchenko
Starting at$100
Duration3 days
Tags
Microsoft Excel
Data Analyst
Presentation Designer
Business Intelligence
Dashboards
Data Visualisation
You already have the data — in spreadsheets, exports or a pile of CSVs. What you don't have is a clear picture you can act on or show to others.
I turn your raw data into a clean, branded report or dashboard: the numbers rolled up, cross-checked, and laid out so the story is obvious at a glance.
What you get:
• Your data cleaned and consolidated — duplicates and mismatches caught, not carried through.
• Roll-ups that matter: by month, category, supplier, product or region — your call.
• Clear charts and tables, on-brand and ready to share.
• A short written read-out: what the numbers say and what to do next.
• Delivered as a polished PDF and/or an interactive Excel dashboard.
Packages:
• Single View ($100, 3 days) — one source file, ~2,000 rows, one report or dashboard view, up to 5 charts or tables, branded PDF.
• Report + Interactive Dashboard ($175, 5 days) — up to 3 files, ~25,000 rows, consolidated and reconciled, 3 views, interactive Excel plus a written read-out.
• Recurring Reporting Pack ($400, 10 days) — everything above plus 5 views, a reusable monthly template, automatic consistency checks, a 30-minute walkthrough and a month of support.
Why it's reliable: figures are reconciled before they're charted — in a live 6-month deployment my pipeline reconciled 484 records and auto-caught 75 mismatches. You present numbers you can trust.
Send a sample of your data and I'll show you the layout that fits.
FAQs
Example work
$100