
Robust Data Visualization - Dashboards for your data insights!Reid McMillan
I focus on design best practices to bring your data to life with beautiful charts and dashboards that provide deep business insights that lead to confident decisions. I partner with you to ensure that the product I deliver is providing true value to your day to day operations or high level action.
What's included
Create Data Visualization - Tableau, Power BI, etc
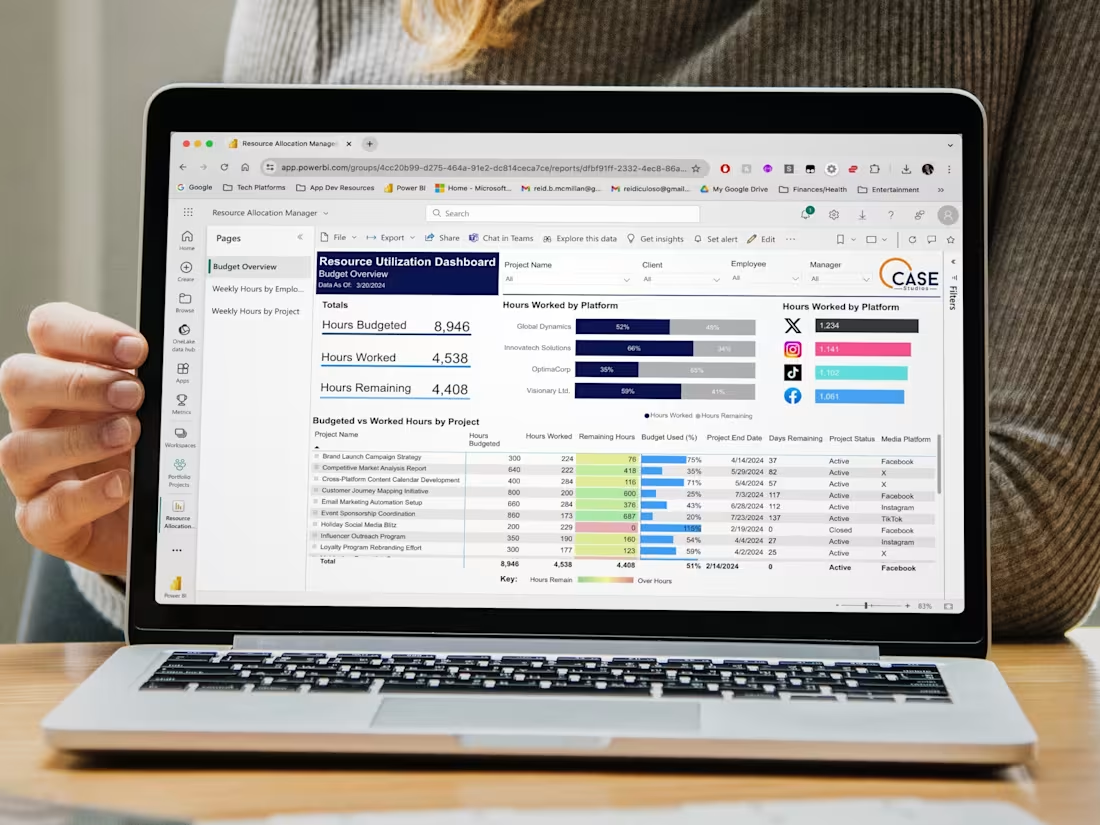
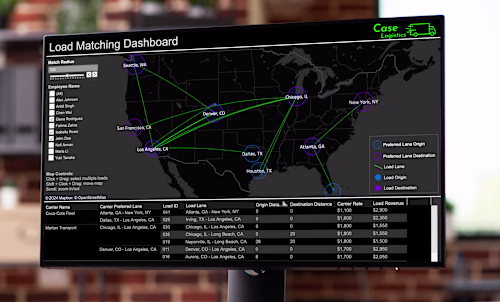
In Tableau, Power BI, or similar data viz platform, I will create a data viz element with clean data provided including: Bar Charts, Stacked Bars, Pie Charts, Line Charts (trends over time), Table, Matrix, Tree Map, Geographic Mapping. I will ensure that the visuals provide true insights into the trends in your data. I can include dynamic formatting for easier understanding of patterns.
Build Dashboard - Tableau, Power BI, etc.
In Tableau, Power BI, or similar data viz platform, I will organize different created visual elements into a cohesive dashboard following design best practices, includes: data viz elements (charts/tables/maps), filters/slicers, interactive filtering, tooltips, titles, descriptions, user guidance.
Reid's other services
Starting at$65 /hr
Tags
Microsoft Excel
Microsoft Power BI
Microsoft PowerPoint
Tableau
Data Analyst
Data Scientist
Data Visualizer
Service provided by
Reid McMillan Fort Myers Beach, USA
Robust Data Visualization - Dashboards for your data insights!Reid McMillan
Starting at$65 /hr
Tags
Microsoft Excel
Microsoft Power BI
Microsoft PowerPoint
Tableau
Data Analyst
Data Scientist
Data Visualizer
I focus on design best practices to bring your data to life with beautiful charts and dashboards that provide deep business insights that lead to confident decisions. I partner with you to ensure that the product I deliver is providing true value to your day to day operations or high level action.
What's included
Create Data Visualization - Tableau, Power BI, etc
In Tableau, Power BI, or similar data viz platform, I will create a data viz element with clean data provided including: Bar Charts, Stacked Bars, Pie Charts, Line Charts (trends over time), Table, Matrix, Tree Map, Geographic Mapping. I will ensure that the visuals provide true insights into the trends in your data. I can include dynamic formatting for easier understanding of patterns.
Build Dashboard - Tableau, Power BI, etc.
In Tableau, Power BI, or similar data viz platform, I will organize different created visual elements into a cohesive dashboard following design best practices, includes: data viz elements (charts/tables/maps), filters/slicers, interactive filtering, tooltips, titles, descriptions, user guidance.
Reid's other services
$65 /hr