
Multifaceted Tech Expert: Technical Support & Data AnalystNishan Aravinda
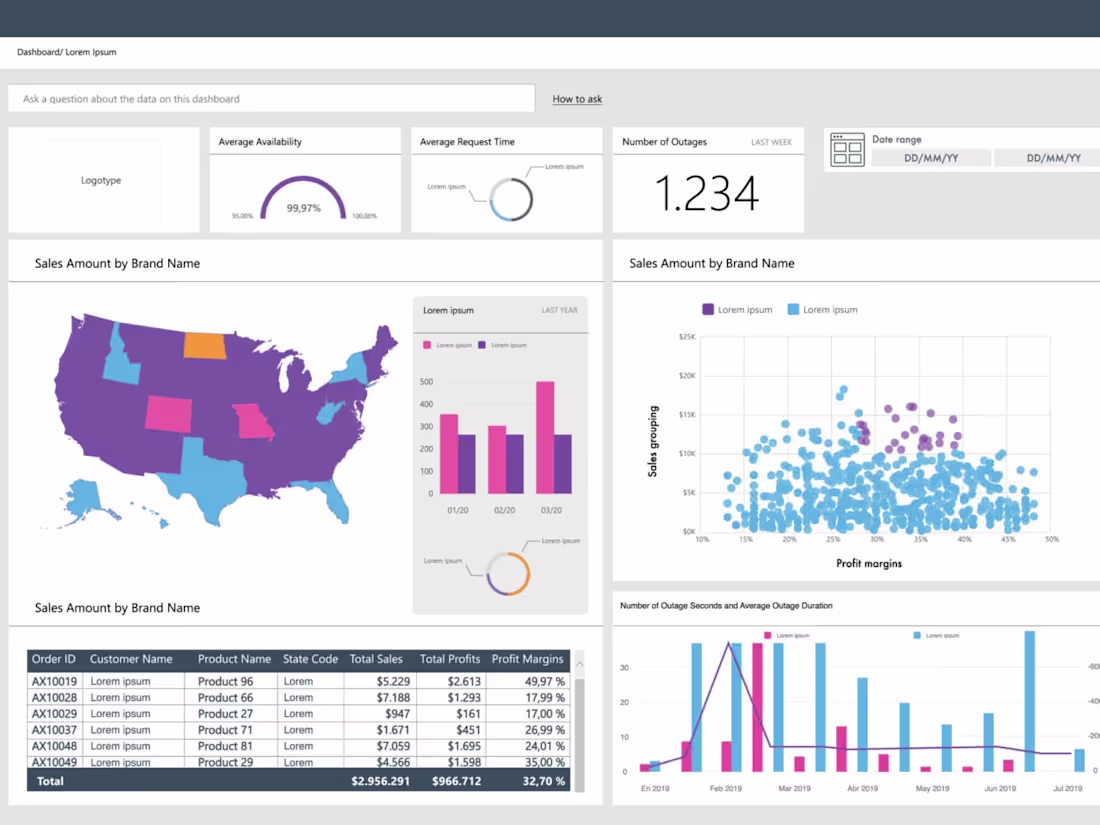
Customized Data Visualizations
Visual Design Assets
Data Analysis Reports
Documentation
Data Cleaning and Preprocessing
Storyboard or Presentation
Feedback and Revisions
What's included
Customized Data Visualizations:
Engaging charts, graphs, and visual representations of data tailored to the client's needs.
Interactive dashboards for dynamic exploration of datasets.
Visual Design Assets:
Visually appealing infographics summarizing key findings.
Branded visual elements that align with the client's identity.
Data Analysis Reports:
Comprehensive reports outlining insights derived from the visualizations.
Clear explanations of trends, patterns, and outliers within the data.
Documentation:
Detailed documentation on the methodologies used for data visualization.
User guides for understanding and interacting with the visualizations.
Data Cleaning and Preprocessing:
Cleaned and organized datasets ready for analysis.
Documentation on data cleaning processes and transformations.
Storyboard or Presentation:
A narrative or presentation outlining the story told by the visualizations.
A walkthrough of key insights and recommendations.
Feedback and Revisions:
A feedback loop for the client to provide input on the visualizations.
Revisions based on client feedback to ensure satisfaction.
Training Materials (Optional):
If applicable, training materials for clients or end-users on interpreting visualizations.
Workshops or sessions to guide clients through the use of interactive dashboards.
Nishan's other services

Contact for pricing
Tags
Google Cloud Platform
Google Tag Manager
Linux
Slack
Data Entry Specialist
Data Visualizer
Technical Support Specialist
Service provided by
Nishan Aravinda Colombo, Sri Lanka
Multifaceted Tech Expert: Technical Support & Data AnalystNishan Aravinda
Contact for pricing
Tags
Google Cloud Platform
Google Tag Manager
Linux
Slack
Data Entry Specialist
Data Visualizer
Technical Support Specialist
Customized Data Visualizations
Visual Design Assets
Data Analysis Reports
Documentation
Data Cleaning and Preprocessing
Storyboard or Presentation
Feedback and Revisions
What's included
Customized Data Visualizations:
Engaging charts, graphs, and visual representations of data tailored to the client's needs.
Interactive dashboards for dynamic exploration of datasets.
Visual Design Assets:
Visually appealing infographics summarizing key findings.
Branded visual elements that align with the client's identity.
Data Analysis Reports:
Comprehensive reports outlining insights derived from the visualizations.
Clear explanations of trends, patterns, and outliers within the data.
Documentation:
Detailed documentation on the methodologies used for data visualization.
User guides for understanding and interacting with the visualizations.
Data Cleaning and Preprocessing:
Cleaned and organized datasets ready for analysis.
Documentation on data cleaning processes and transformations.
Storyboard or Presentation:
A narrative or presentation outlining the story told by the visualizations.
A walkthrough of key insights and recommendations.
Feedback and Revisions:
A feedback loop for the client to provide input on the visualizations.
Revisions based on client feedback to ensure satisfaction.
Training Materials (Optional):
If applicable, training materials for clients or end-users on interpreting visualizations.
Workshops or sessions to guide clients through the use of interactive dashboards.
Nishan's other services
Contact for pricing