
Will create interactive beautiful tableau and PowerBi dashboardsOdefe Oberabor
Dozens of succesfully completed jobs & satisfied clients. 6+ years work experience. I specialize in transforming complex datasets into actionable insights, increasing growth and innovation. Measurable quantifiable results are my priority.
What's included
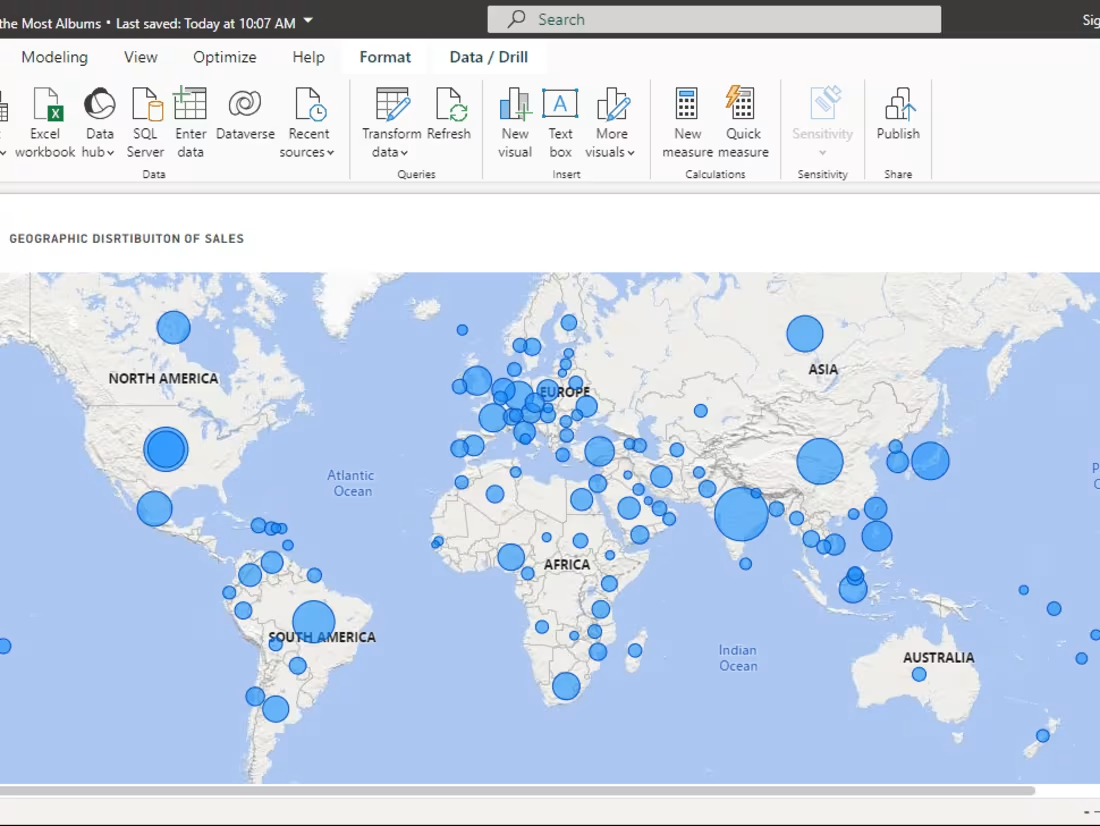
Interactive Power BI or Tableau dashboard
Objective: Define the purpose of the dashboard (e.g., sales performance, customer insights).
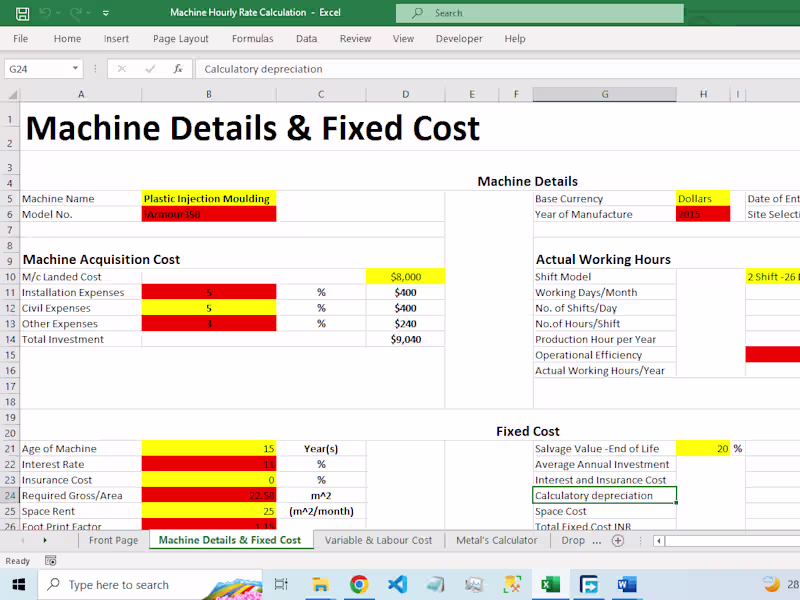
Data Sources: Identify and connect to data sources (e.g., SQL database, Excel files).
Data Preparation: Clean and transform data as needed.
KPI Selection: Choose key performance indicators relevant to the objective.
Visualization: Create visualizations (e.g., charts, tables) to represent data.
Dashboard Layout: Arrange visualizations in a user-friendly format.
Interactivity: Add filters and slicers for user interaction.
Testing: Validate data accuracy and functionality.
Deployment: Publish the dashboard and share access.
Training: Provide training or documentation for end-users.
Odefe's other services
Contact for pricing
Tags
Matplotlib
Microsoft Excel
Microsoft Power BI
Tableau
Data Analyst
Data Scientist
Data Visualizer
Service provided by
Odefe Oberabor Nigeria
Will create interactive beautiful tableau and PowerBi dashboardsOdefe Oberabor
Contact for pricing
Tags
Matplotlib
Microsoft Excel
Microsoft Power BI
Tableau
Data Analyst
Data Scientist
Data Visualizer
Dozens of succesfully completed jobs & satisfied clients. 6+ years work experience. I specialize in transforming complex datasets into actionable insights, increasing growth and innovation. Measurable quantifiable results are my priority.
What's included
Interactive Power BI or Tableau dashboard
Objective: Define the purpose of the dashboard (e.g., sales performance, customer insights).
Data Sources: Identify and connect to data sources (e.g., SQL database, Excel files).
Data Preparation: Clean and transform data as needed.
KPI Selection: Choose key performance indicators relevant to the objective.
Visualization: Create visualizations (e.g., charts, tables) to represent data.
Dashboard Layout: Arrange visualizations in a user-friendly format.
Interactivity: Add filters and slicers for user interaction.
Testing: Validate data accuracy and functionality.
Deployment: Publish the dashboard and share access.
Training: Provide training or documentation for end-users.
Odefe's other services
Contact for pricing