
Comprehensive Dashboard Redesign or Restructure.Oluwatosin Lawal
Revamped dashboards to improve visualisation and usability for clients, leveraging diverse tools and techniques. Dashboards will be updated and set up in a way that they refresh automatically.
What's included
Improved Dashboard Layout
Improved navigation and style in the dashboard interface, which guarantees simplicity of use and rapid access to key metrics
Data Integration and ETL Process Documentation
Extensive documentation covering data sources, transformation logic, and loading procedures related to data integration and ETL (Extract, Transform, Load) processes.
Interactive Visualizations
Interactive and dynamic visualizations such as charts, graphs, and maps that allow users to explore data in more detail and gain deeper insights.
Performance Metrics and KPIs
Key performance indicators (KPIs) and metrics that are precisely specified and presented in a way that is consistent with the client's business goals, guaranteeing that the dashboard offers pertinent and useful information.
Automated Reporting
Set up of automated reporting features that enable scheduled generation and distribution of reports directly from the dashboard
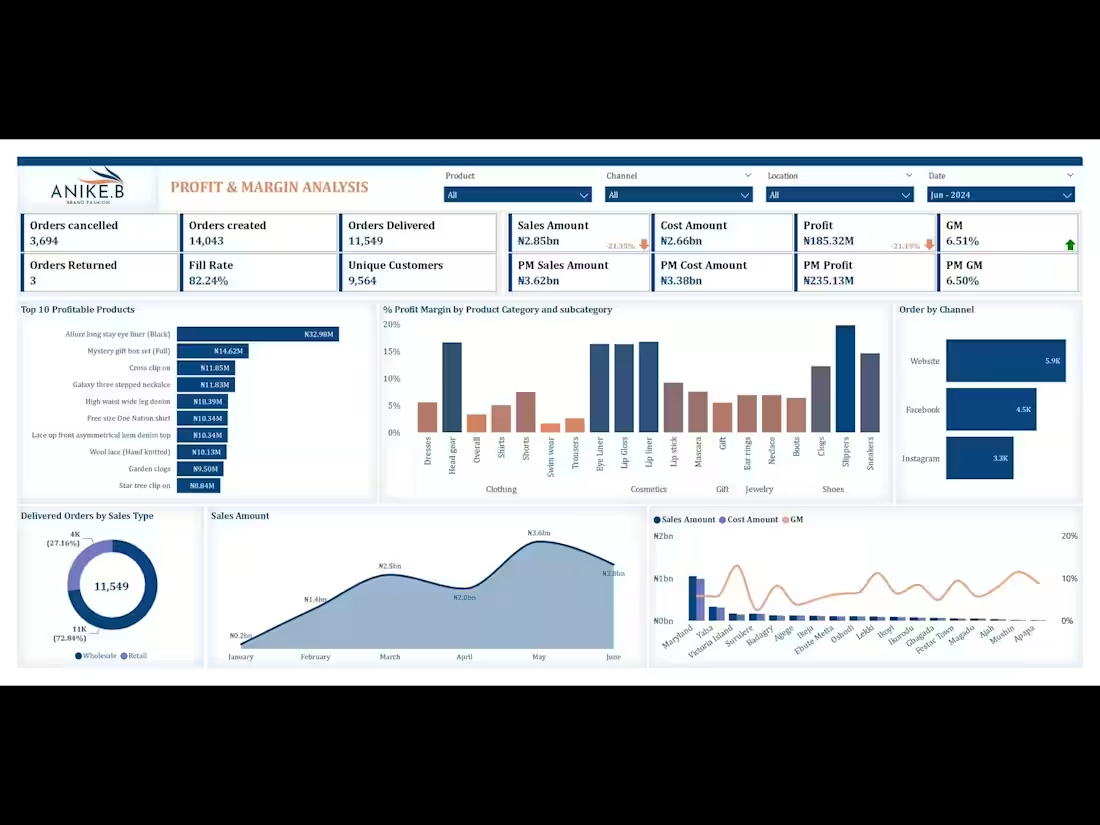
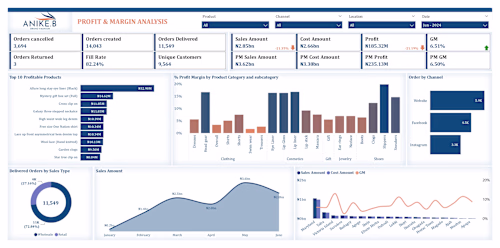
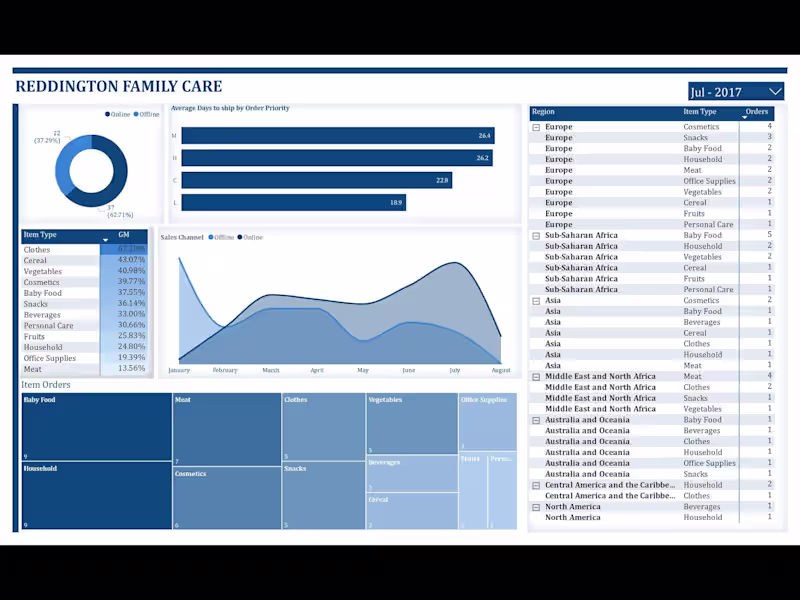
Example work
Oluwatosin's other services
Starting at$2,500
Duration3 weeks
Tags
Excel VBA
Looker Studio
Microsoft Power BI
Mixpanel
Tableau
Data Analyst
Data Visualizer
Service provided by
Oluwatosin Lawal Lagos, Nigeria
- 1
- Paid projects
- 5.00
- Rating
- 9
- Followers
Comprehensive Dashboard Redesign or Restructure.Oluwatosin Lawal
Starting at$2,500
Duration3 weeks
Tags
Excel VBA
Looker Studio
Microsoft Power BI
Mixpanel
Tableau
Data Analyst
Data Visualizer
Revamped dashboards to improve visualisation and usability for clients, leveraging diverse tools and techniques. Dashboards will be updated and set up in a way that they refresh automatically.
What's included
Improved Dashboard Layout
Improved navigation and style in the dashboard interface, which guarantees simplicity of use and rapid access to key metrics
Data Integration and ETL Process Documentation
Extensive documentation covering data sources, transformation logic, and loading procedures related to data integration and ETL (Extract, Transform, Load) processes.
Interactive Visualizations
Interactive and dynamic visualizations such as charts, graphs, and maps that allow users to explore data in more detail and gain deeper insights.
Performance Metrics and KPIs
Key performance indicators (KPIs) and metrics that are precisely specified and presented in a way that is consistent with the client's business goals, guaranteeing that the dashboard offers pertinent and useful information.
Automated Reporting
Set up of automated reporting features that enable scheduled generation and distribution of reports directly from the dashboard
Example work
Oluwatosin's other services
$2,500