
I will create charts and dashboards from your data Adarsh Dubey
I will clean, format, and automate your Excel/CSV data using Python, saving you hours of manual work. Unlike simple data entry, I build reusable scripts so your workflow stays automated and error-free.
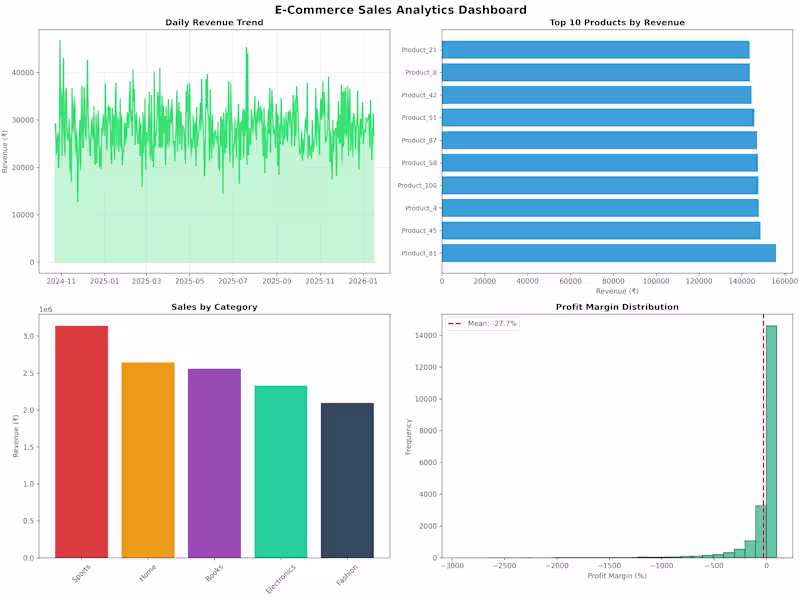
I turn raw data into clear, professional charts and dashboards using Python. My unique edge is creating visuals that are not just attractive but also business-ready and easy to interpret.
What's included
Data Cleaning & Excel Automation
Cleaned & formatted Excel/CSV files
Automated Python script (reusable)
Removal of duplicates, errors, and missing values
Report/summary of cleaned dataset
Data Visualization & Dashboards
3–5 professional charts/visuals (PNG/PDF)
Python notebook/script (for reproducibility)
Summary report explaining insights
Dashboard (Excel or Python-based, depending on package)
Adarsh's other services
Starting at$30
Duration1 week
Tags
D3.js
Matplotlib
Tableau
TensorFlow
three.js
Data Analyst
Data Scientist
Data Visualizer
Service provided by
Adarsh Dubey Mumbai, India
I will create charts and dashboards from your data Adarsh Dubey
Starting at$30
Duration1 week
Tags
D3.js
Matplotlib
Tableau
TensorFlow
three.js
Data Analyst
Data Scientist
Data Visualizer
I will clean, format, and automate your Excel/CSV data using Python, saving you hours of manual work. Unlike simple data entry, I build reusable scripts so your workflow stays automated and error-free.
I turn raw data into clear, professional charts and dashboards using Python. My unique edge is creating visuals that are not just attractive but also business-ready and easy to interpret.
What's included
Data Cleaning & Excel Automation
Cleaned & formatted Excel/CSV files
Automated Python script (reusable)
Removal of duplicates, errors, and missing values
Report/summary of cleaned dataset
Data Visualization & Dashboards
3–5 professional charts/visuals (PNG/PDF)
Python notebook/script (for reproducibility)
Summary report explaining insights
Dashboard (Excel or Python-based, depending on package)
Adarsh's other services
$30