
Data Visualization in Looker StudioStefan Schilder
I offer a detailed, structured framework for summarizing your Looker Studio dashboard, moving beyond simple data source listings to focus on core objectives, actionable insights, and business impact. My unique approach ensures the summary clarifies what questions the report answers and what specific actions users can take based on the blended GA4, Google Ads, and GSC data.
What's included
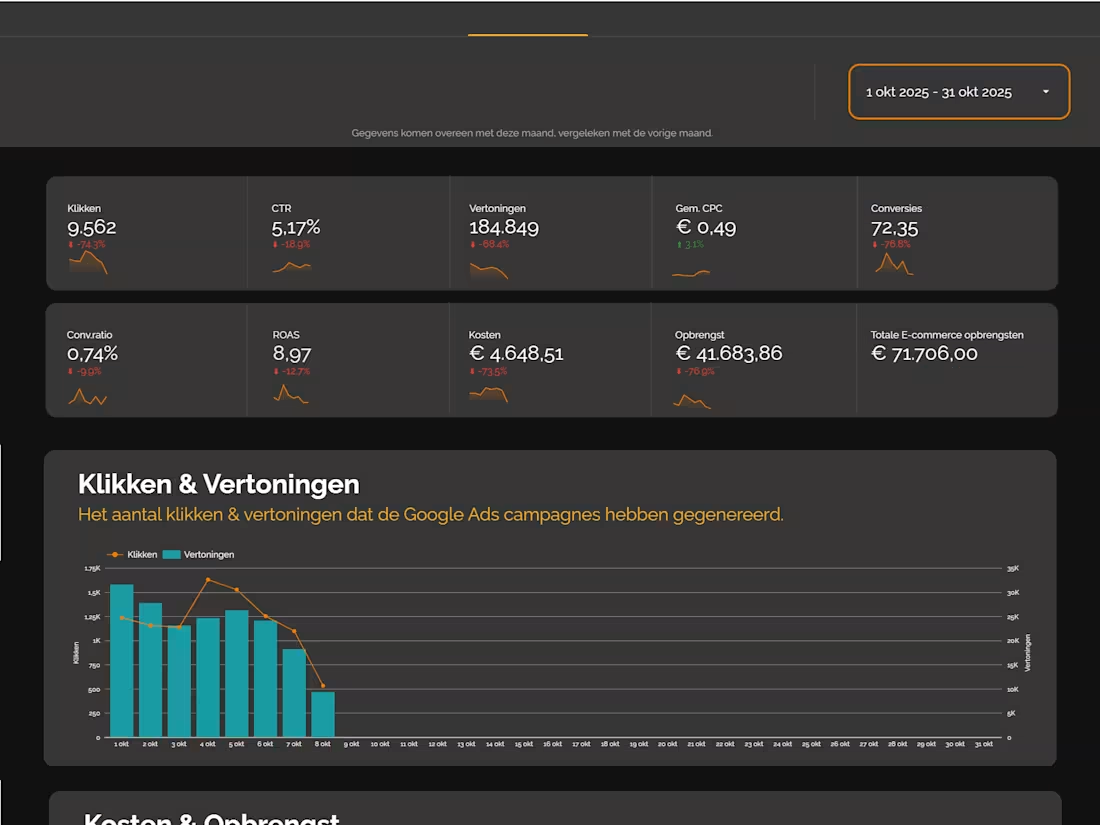
A full functional dashboard
A looker studio dashboard that contains data connectors like GA4 / Google Ads & Google Search Console.
A dashboard is always custom work*
This dashboard integrates the following key data sources to provide a unified view:
- Google Analytics 4 (GA4): Focuses on user behavior and on-site performance.
Key Metrics: Sessions, Conversion Rate (by goal), and user demographics/technology breakdown.
- Google Ads: Focuses on paid media performance and cost efficiency.
Key Metrics: Cost, Impressions, Clicks, Click-Through Rate (CTR), and Return on Ad Spend (ROAS).
- Google Search Console (GSC): Focuses on organic search visibility and demand.
Key Metrics: Total Clicks, Total Impressions, Average Position, and top-performing Queries and Pages.
Documentation
Data Mapping Document
- A table detailing every custom field, calculation, and blended data source used in the dashboard.
Example: [Blended Metric Name] = GA4 Session Count + GSC Total Impressions.
Data Connector Configuration
- A step-by-step record of how each connector was set up and authenticated (which view, which account, etc.).
Access & Sharing Matrix
- A list of all stakeholders who have view/edit access to the dashboard and the underlying data sources.
Contact for pricing
Tags
Looker Studio
Data Analyst
Data Visualizer
Service provided by
Stefan Schilder proVolendam, Netherlands
- 5
- Followers
Data Visualization in Looker StudioStefan Schilder
I offer a detailed, structured framework for summarizing your Looker Studio dashboard, moving beyond simple data source listings to focus on core objectives, actionable insights, and business impact. My unique approach ensures the summary clarifies what questions the report answers and what specific actions users can take based on the blended GA4, Google Ads, and GSC data.
What's included
A full functional dashboard
A looker studio dashboard that contains data connectors like GA4 / Google Ads & Google Search Console.
A dashboard is always custom work*
This dashboard integrates the following key data sources to provide a unified view:
- Google Analytics 4 (GA4): Focuses on user behavior and on-site performance.
Key Metrics: Sessions, Conversion Rate (by goal), and user demographics/technology breakdown.
- Google Ads: Focuses on paid media performance and cost efficiency.
Key Metrics: Cost, Impressions, Clicks, Click-Through Rate (CTR), and Return on Ad Spend (ROAS).
- Google Search Console (GSC): Focuses on organic search visibility and demand.
Key Metrics: Total Clicks, Total Impressions, Average Position, and top-performing Queries and Pages.
Documentation
Data Mapping Document
- A table detailing every custom field, calculation, and blended data source used in the dashboard.
Example: [Blended Metric Name] = GA4 Session Count + GSC Total Impressions.
Data Connector Configuration
- A step-by-step record of how each connector was set up and authenticated (which view, which account, etc.).
Access & Sharing Matrix
- A list of all stakeholders who have view/edit access to the dashboard and the underlying data sources.
Contact for pricing