
Data and Business analyst || Pro in Data visualization Princess Anthony
Data got you down? I'm here to help! As a data storyteller, I
1️⃣Analyze the numbers
2️⃣Visualize the insights
3️⃣Provide actionable advice
My goal? Help businesses like yours make informed decisions and drive growth.
What's included
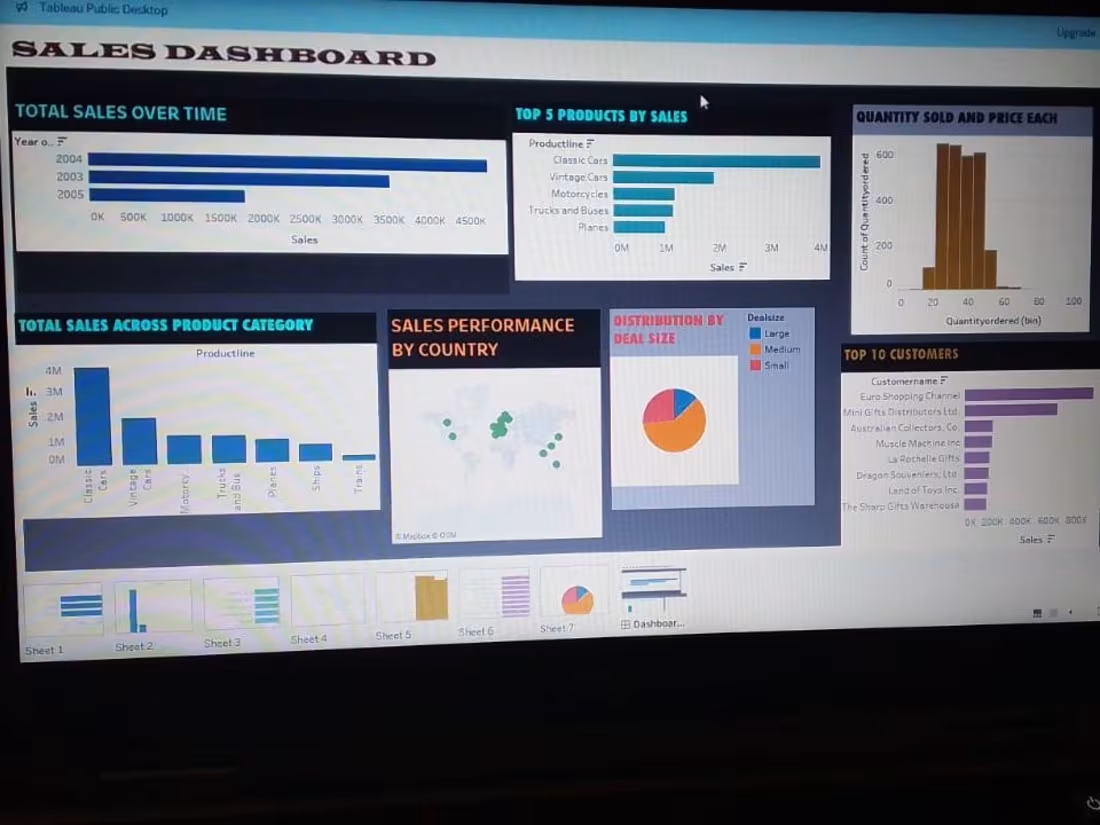
Data Analytics and visualization
As a Data Analyst and Visualization specialist, I uncover insights hidden within data, transforming complex information into actionable stories. My goal is to empower stakeholders to make informed decisions.
My Responsibilities:
1. I collect, clean, and analyze data from various sources.
2. I identify trends, patterns, and correlations to inform business strategies.
3. I design and develop interactive dashboards, reports, and visualizations.
4. I collaborate with stakeholders to understand their data needs.
5. I provide data-driven recommendations to optimize processes.
My Skills:
1. Data analysis and modeling (SQL, Excel, Python).
2. Data visualization tools (Tableau, Power BI).
3. Statistical knowledge (regression, hypothesis testing).
4. Data storytelling and communication.
5. Business acumen and industry knowledge.
My Deliverables:
1. Interactive dashboards and reports.
2. Data visualizations (charts, graphs, heat maps).
3. Statistical models and forecasts.
4. Data-driven recommendations.
5. Ad-hoc analysis and insights.
My Impact:
1. Informed business decisions through data-driven insights.
2. Improved process efficiency and optimization.
3. Enhanced customer understanding.
4. Identified areas for cost reduction.
5. Strategic alignment with business objectives.
Why I Love Being a Data Analyst and Visualization Specialist:
1. I uncover hidden patterns and trends.
2. I tell compelling stories with data.
3. I empower stakeholders to make informed decisions.
4. I continuously learn and adapt.
5. I see tangible results.
My Tools and Technologies:
1. Data visualization tools (Tableau, Power BI).
2. Programming languages (Python,SQL).
3. Data manipulation and analysis (Excel).
4. Machine learning libraries (scikit-learn, TensorFlow).
5. Cloud-based platforms (AWS).
Business Analysis
As a Business Analyst, I play a crucial part in bridging the gap between business needs and technology solutions. My primary goal is to drive business growth, improve processes, and enhance decision-making.
My Responsibilities:
1. I collaborate with stakeholders to identify business requirements and define project scopes.
2. I analyze data, processes, and technology to pinpoint areas for improvement.
3. I develop business cases, proposals, and reports to communicate findings and recommendations.
4. I design and implement solutions, working closely with developers, project managers, and subject matter experts.
5. I facilitate workshops, meetings, and training sessions to ensure smooth adoption.
My Skills:
1. Strategic thinking and problem-solving.
2. Effective communication and stakeholder management.
3. Business process analysis and re-engineering.
4. Data analysis and visualization.
5. Technical expertise (e.g., SQL, data modeling).
My Deliverables:
1. Business requirements documents (BRDs).
2. Technical specifications.
3. Process maps and workflows.
4. Data models and dashboards.
5. Project plans and status reports.
My Impact:
1. Improved business efficiency and productivity.
2. Enhanced decision-making through data-driven insights.
3. Increased customer satisfaction.
4. Reduced costs and optimized resources.
5. Strategic alignment with business objectives.
Why I Love Being a Business Analyst:
1. I get to solve complex problems.
2. I collaborate with diverse teams.
3. I drive meaningful change.
4. I learn continuously.
5. I see tangible results.
Princess's other services

Starting at$70 /hr
Tags
Microsoft Excel
pandas
Tableau
Data Analyst
Data Modelling Analyst
Data Scientist
Service provided by
Princess Anthony Nigeria
Data and Business analyst || Pro in Data visualization Princess Anthony
Starting at$70 /hr
Tags
Microsoft Excel
pandas
Tableau
Data Analyst
Data Modelling Analyst
Data Scientist
Data got you down? I'm here to help! As a data storyteller, I
1️⃣Analyze the numbers
2️⃣Visualize the insights
3️⃣Provide actionable advice
My goal? Help businesses like yours make informed decisions and drive growth.
What's included
Data Analytics and visualization
As a Data Analyst and Visualization specialist, I uncover insights hidden within data, transforming complex information into actionable stories. My goal is to empower stakeholders to make informed decisions.
My Responsibilities:
1. I collect, clean, and analyze data from various sources.
2. I identify trends, patterns, and correlations to inform business strategies.
3. I design and develop interactive dashboards, reports, and visualizations.
4. I collaborate with stakeholders to understand their data needs.
5. I provide data-driven recommendations to optimize processes.
My Skills:
1. Data analysis and modeling (SQL, Excel, Python).
2. Data visualization tools (Tableau, Power BI).
3. Statistical knowledge (regression, hypothesis testing).
4. Data storytelling and communication.
5. Business acumen and industry knowledge.
My Deliverables:
1. Interactive dashboards and reports.
2. Data visualizations (charts, graphs, heat maps).
3. Statistical models and forecasts.
4. Data-driven recommendations.
5. Ad-hoc analysis and insights.
My Impact:
1. Informed business decisions through data-driven insights.
2. Improved process efficiency and optimization.
3. Enhanced customer understanding.
4. Identified areas for cost reduction.
5. Strategic alignment with business objectives.
Why I Love Being a Data Analyst and Visualization Specialist:
1. I uncover hidden patterns and trends.
2. I tell compelling stories with data.
3. I empower stakeholders to make informed decisions.
4. I continuously learn and adapt.
5. I see tangible results.
My Tools and Technologies:
1. Data visualization tools (Tableau, Power BI).
2. Programming languages (Python,SQL).
3. Data manipulation and analysis (Excel).
4. Machine learning libraries (scikit-learn, TensorFlow).
5. Cloud-based platforms (AWS).
Business Analysis
As a Business Analyst, I play a crucial part in bridging the gap between business needs and technology solutions. My primary goal is to drive business growth, improve processes, and enhance decision-making.
My Responsibilities:
1. I collaborate with stakeholders to identify business requirements and define project scopes.
2. I analyze data, processes, and technology to pinpoint areas for improvement.
3. I develop business cases, proposals, and reports to communicate findings and recommendations.
4. I design and implement solutions, working closely with developers, project managers, and subject matter experts.
5. I facilitate workshops, meetings, and training sessions to ensure smooth adoption.
My Skills:
1. Strategic thinking and problem-solving.
2. Effective communication and stakeholder management.
3. Business process analysis and re-engineering.
4. Data analysis and visualization.
5. Technical expertise (e.g., SQL, data modeling).
My Deliverables:
1. Business requirements documents (BRDs).
2. Technical specifications.
3. Process maps and workflows.
4. Data models and dashboards.
5. Project plans and status reports.
My Impact:
1. Improved business efficiency and productivity.
2. Enhanced decision-making through data-driven insights.
3. Increased customer satisfaction.
4. Reduced costs and optimized resources.
5. Strategic alignment with business objectives.
Why I Love Being a Business Analyst:
1. I get to solve complex problems.
2. I collaborate with diverse teams.
3. I drive meaningful change.
4. I learn continuously.
5. I see tangible results.
Princess's other services
$70 /hr