
Interactive Data Visualization DashboardEduardo Batalha
A stunning and informative dashboard to monitor your business performance! My aim is to design a distinctive dashboard that suits your needs and your business, from data model to dashboard creation to teaching you how to get the most out of the dashboard.
What's included
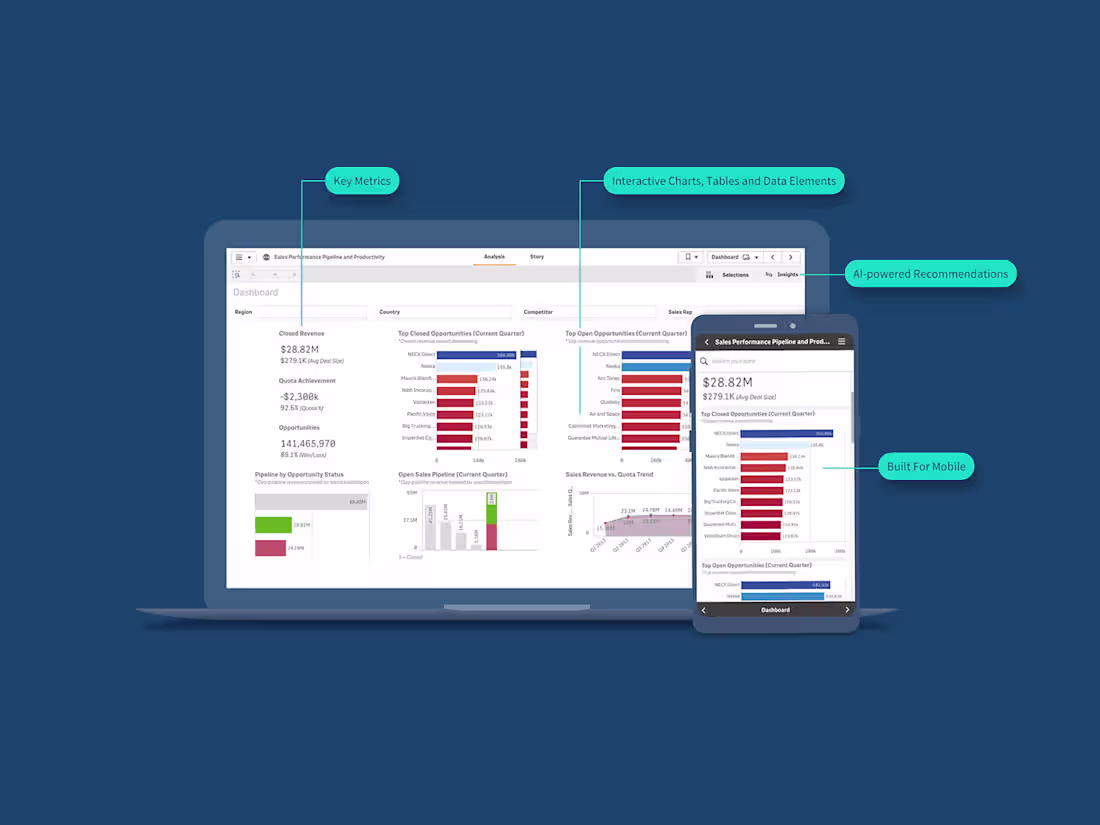
Clean dashboard
An engaging and interactive dashboard that tracks your data with the essential metrics that you care about.
Data filtering
Development of the data model to enable data flow to the dashboard from the available sources. If necessary, the raw data will undergo data transformation and modelling process to guarantee optimal performance of the final dashboard.
Mobile visualization
Your dashboard will be 100% accessible via mobile devices
A tour through the completed dashboard
A brief guide to the dashboard that has been created to help you get the most useful insights and understand how to view and analyze the graphics!
Eduardo's other services
Starting at$25 /hr
Tags
Matplotlib
Python
PyTorch
SQL
Data Analyst
Data Scientist
Data Visualizer
Service provided by
Eduardo Batalha São Paulo, Brazil
Interactive Data Visualization DashboardEduardo Batalha
Starting at$25 /hr
Tags
Matplotlib
Python
PyTorch
SQL
Data Analyst
Data Scientist
Data Visualizer
A stunning and informative dashboard to monitor your business performance! My aim is to design a distinctive dashboard that suits your needs and your business, from data model to dashboard creation to teaching you how to get the most out of the dashboard.
What's included
Clean dashboard
An engaging and interactive dashboard that tracks your data with the essential metrics that you care about.
Data filtering
Development of the data model to enable data flow to the dashboard from the available sources. If necessary, the raw data will undergo data transformation and modelling process to guarantee optimal performance of the final dashboard.
Mobile visualization
Your dashboard will be 100% accessible via mobile devices
A tour through the completed dashboard
A brief guide to the dashboard that has been created to help you get the most useful insights and understand how to view and analyze the graphics!
Eduardo's other services
$25 /hr