
Data Analysis & Insightful DashboardsCiro
I provide remote‑first data analysis that transforms raw information into clear, actionable insights. Using tools like Power BI, Excel, Python, SQL, and PostgreSQL, I deliver interactive dashboards, optimized queries, and concise reports that empower smarter decisions. My async‑friendly approach ensures seamless collaboration across time zones, making complex analytics accessible and efficient for global clients.
What's included
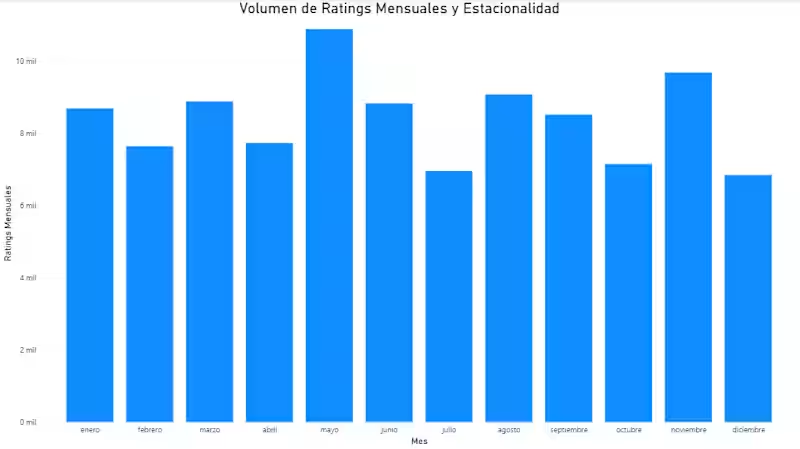
Interactive Power BI Dashboards
Custom dashboards designed in Power BI, featuring clear KPIs, dynamic filters, and intuitive visual storytelling to transform complex data into actionable insights.
Custom Excel Reports
Tailored Excel reports with pivot tables, charts, and automated calculations, providing structured views of your data for quick decision‑making.
Optimized SQL/PostgreSQL Queries
Efficient, well‑documented SQL and PostgreSQL queries that streamline data extraction, improve performance, and ensure reproducibility across projects.
Python Notebooks and Scripts
Reusable Python notebooks or scripts for data cleaning, transformation, and automation, enabling scalable and reliable workflows
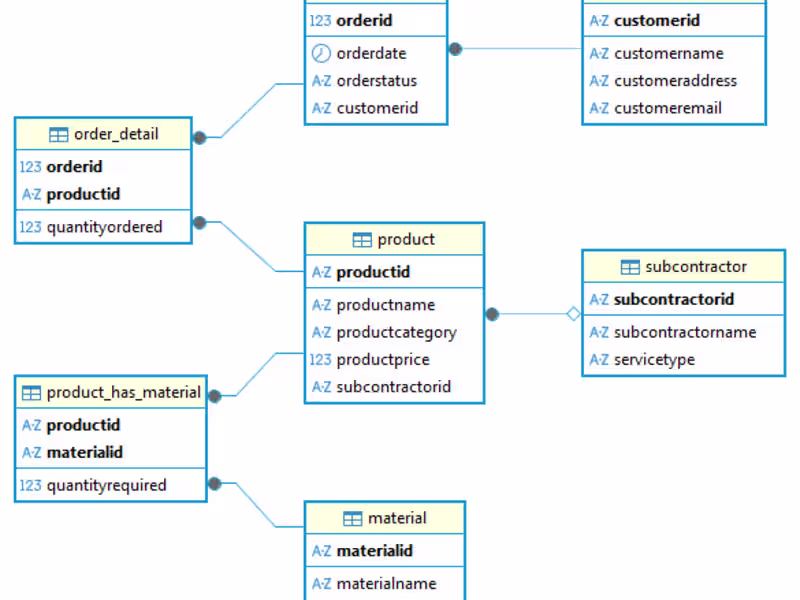
Data Models and Documentation
Clear data models with supporting documentation that explain structure, logic, and workflow, ensuring transparency and easy handoff
Executive Insight Summary
Concise written summary highlighting trends, anomalies, and actionable recommendations, turning technical analysis into business‑ready insights.
FAQs
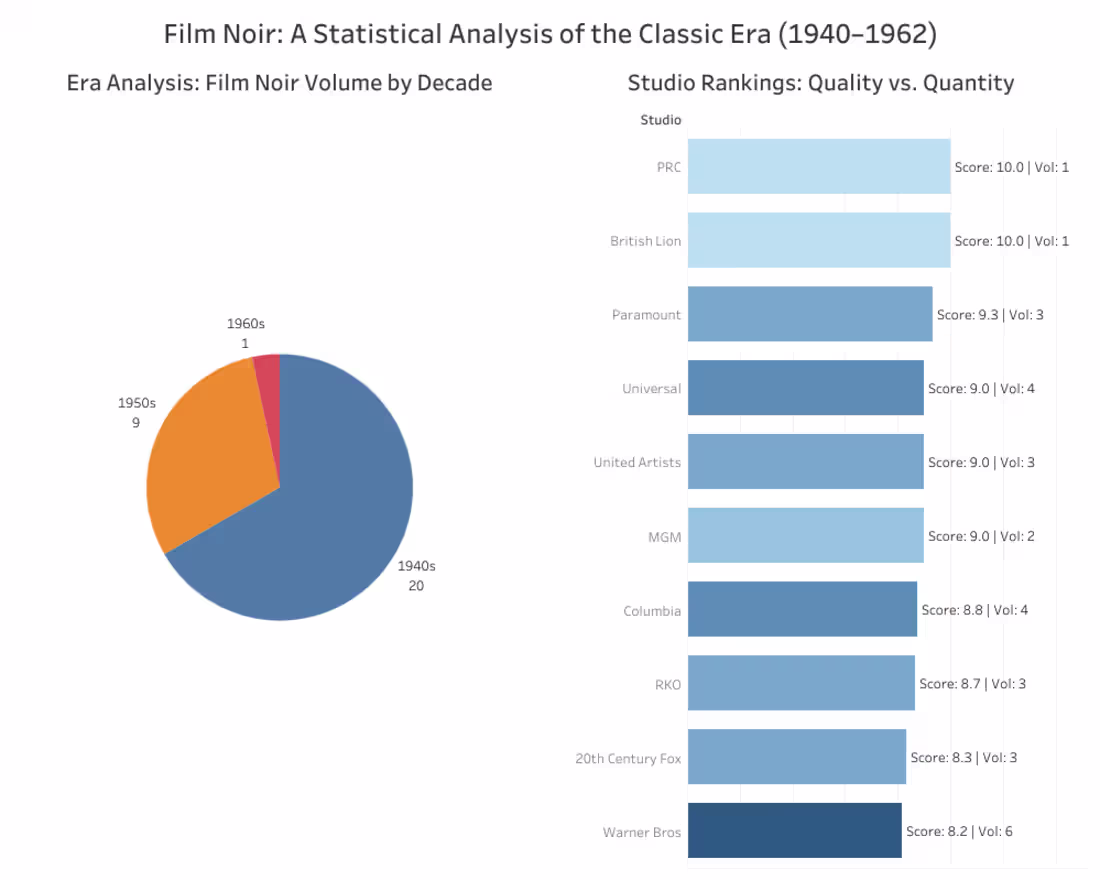
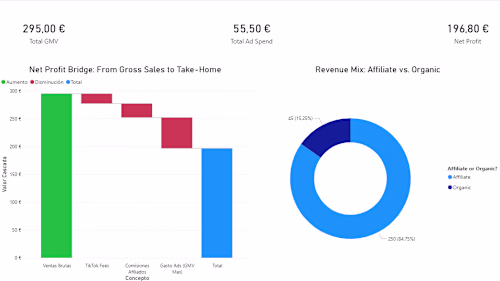
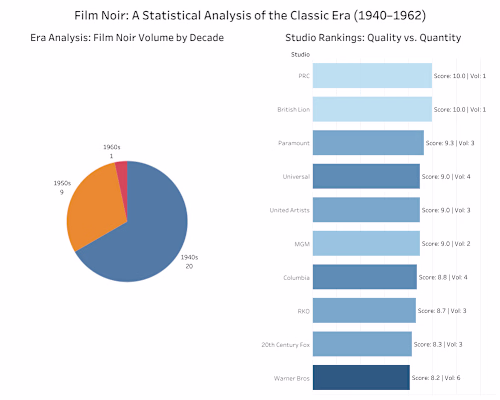
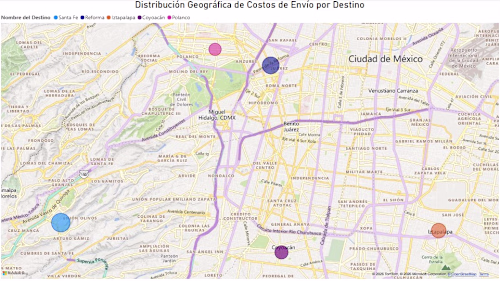
Example work
Ciro's other services
Starting at$50
Duration1 week
Tags
Microsoft Excel
Microsoft Power BI
PostgreSQL
Python
SQL
Data Analyst
Data Modelling Analyst
Data Scientist
Service provided by
Ciro Buenos Aires, Argentina
- 267
- Followers
Data Analysis & Insightful DashboardsCiro
Starting at$50
Duration1 week
Tags
Microsoft Excel
Microsoft Power BI
PostgreSQL
Python
SQL
Data Analyst
Data Modelling Analyst
Data Scientist
I provide remote‑first data analysis that transforms raw information into clear, actionable insights. Using tools like Power BI, Excel, Python, SQL, and PostgreSQL, I deliver interactive dashboards, optimized queries, and concise reports that empower smarter decisions. My async‑friendly approach ensures seamless collaboration across time zones, making complex analytics accessible and efficient for global clients.
What's included
Interactive Power BI Dashboards
Custom dashboards designed in Power BI, featuring clear KPIs, dynamic filters, and intuitive visual storytelling to transform complex data into actionable insights.
Custom Excel Reports
Tailored Excel reports with pivot tables, charts, and automated calculations, providing structured views of your data for quick decision‑making.
Optimized SQL/PostgreSQL Queries
Efficient, well‑documented SQL and PostgreSQL queries that streamline data extraction, improve performance, and ensure reproducibility across projects.
Python Notebooks and Scripts
Reusable Python notebooks or scripts for data cleaning, transformation, and automation, enabling scalable and reliable workflows
Data Models and Documentation
Clear data models with supporting documentation that explain structure, logic, and workflow, ensuring transparency and easy handoff
Executive Insight Summary
Concise written summary highlighting trends, anomalies, and actionable recommendations, turning technical analysis into business‑ready insights.
FAQs
Example work
Ciro's other services
$50