
Drive Business Decisions with Custom Power BI DashboardsHimanshu Dhide
I help businesses make smarter decisions by turning raw, messy data into clean visuals and dashboards using Power BI, SQL, Python, and Excel. What sets me apart? I don’t just visualize data — I extract the insights that actually drive action.
What's included
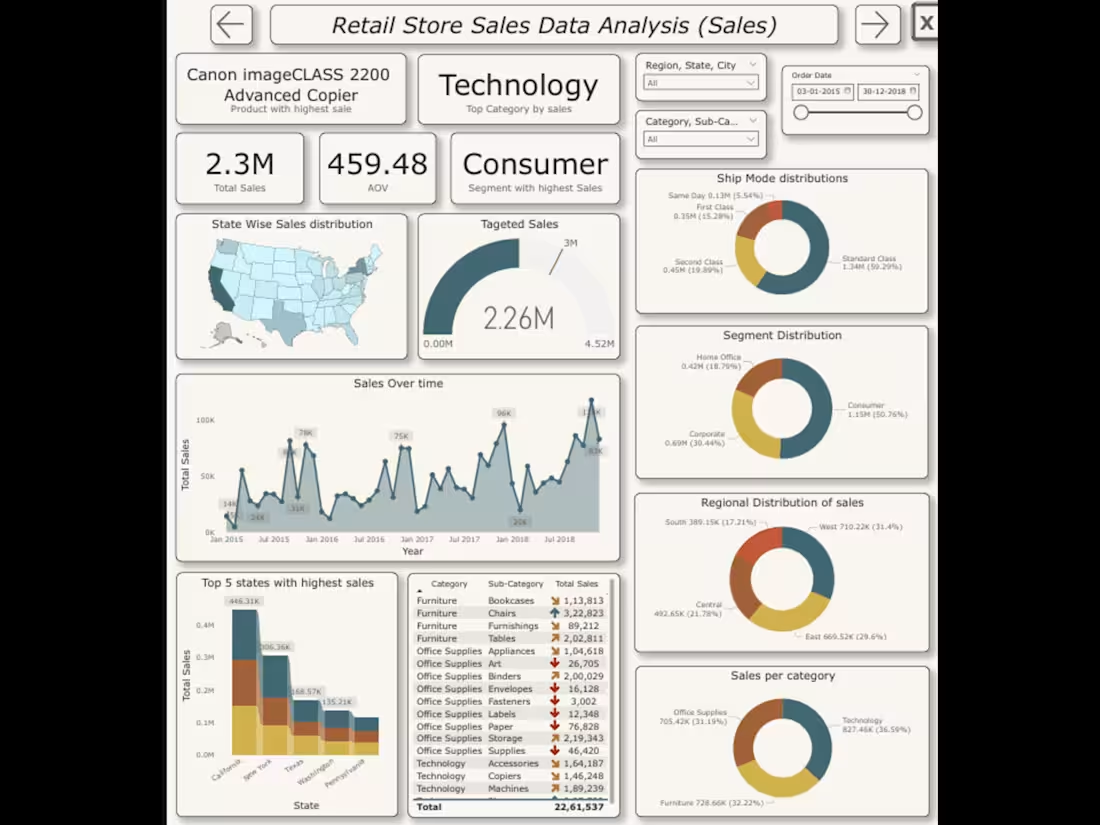
Interactive Power BI Dashboards
A fully interactive dashboard built using Power BI or Excel. Includes slicers, filters, KPIs, and visual insights tailored to your business needs.
Format: .pbix or .xlsx file + screenshots
Revisions: Up to 2 revisions included
Get Data Cleaned
Raw data cleaned, transformed, and formatted for analysis. Missing values handled, duplicates removed, and columns clearly labeled.
Format: .csv or .xlsx file
Revisions: 1 revision included
Insights Summary Report
PDF report or slide deck summarizing key trends, actionable insights, and business recommendations based on the data.
Format: .pdf or .pptx
Revisions: 1 revision included
Deliverable 4: SQL Scripts or Python Notebook
Scripts used for data wrangling or querying.
Delivered in .sql or .ipynb format upon request.
Starting at$5
Duration1 week
Tags
Matplotlib
Microsoft Excel
Microsoft Power BI
seaborn
TensorFlow
Data Analyst
Data Scientist
Data Visualizer
Service provided by
Himanshu Dhide Mumbai, India
Drive Business Decisions with Custom Power BI DashboardsHimanshu Dhide
Starting at$5
Duration1 week
Tags
Matplotlib
Microsoft Excel
Microsoft Power BI
seaborn
TensorFlow
Data Analyst
Data Scientist
Data Visualizer
I help businesses make smarter decisions by turning raw, messy data into clean visuals and dashboards using Power BI, SQL, Python, and Excel. What sets me apart? I don’t just visualize data — I extract the insights that actually drive action.
What's included
Interactive Power BI Dashboards
A fully interactive dashboard built using Power BI or Excel. Includes slicers, filters, KPIs, and visual insights tailored to your business needs.
Format: .pbix or .xlsx file + screenshots
Revisions: Up to 2 revisions included
Get Data Cleaned
Raw data cleaned, transformed, and formatted for analysis. Missing values handled, duplicates removed, and columns clearly labeled.
Format: .csv or .xlsx file
Revisions: 1 revision included
Insights Summary Report
PDF report or slide deck summarizing key trends, actionable insights, and business recommendations based on the data.
Format: .pdf or .pptx
Revisions: 1 revision included
Deliverable 4: SQL Scripts or Python Notebook
Scripts used for data wrangling or querying.
Delivered in .sql or .ipynb format upon request.
$5