
Data Visualization & Business Intelligence DashboardsUsamah W Maphumulo
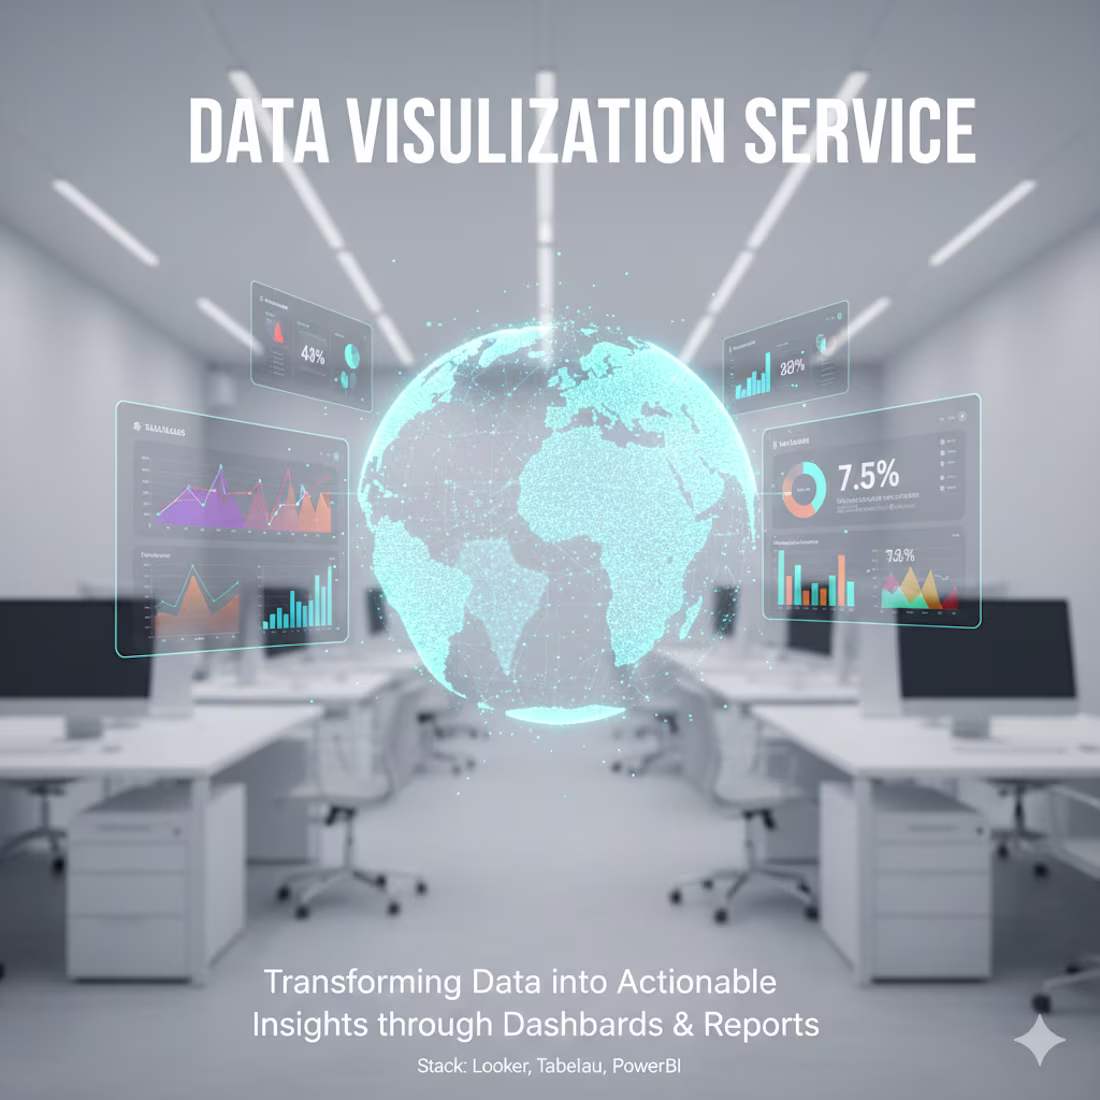
Turn your raw data into a competitive advantage. I provide end-to-end data visualization services designed to transform complex datasets into intuitive, high-impact dashboards that drive faster, smarter decision-making.
Whether you are a startup looking to track KPIs or an established enterprise needing to unify disparate data sources, I specialize in building robust solutions across the industry’s leading BI platforms:
Looker Studio: Perfect for marketing performance tracking and seamless integration with Google Workspace and BigQuery.
Tableau: Ideal for deep-dive exploratory analysis, complex spatial data, and high-performance visual storytelling.
Power BI: The gold standard for organizations within the Microsoft ecosystem, offering powerful DAX modeling and seamless Excel integration.
What’s Included:
Data Strategy & Cleaning: I don’t just build charts; I ensure your data is accurate, structured, and "dashboard-ready."
Custom Visualizations: Bespoke charts, heatmaps, and trend lines tailored to your specific industry metrics.
Interactive Filters: Drill-down capabilities that allow you to explore data by date range, region, or product category.
Automated Refreshing: Set-it-and-forget-it automation so your reports are always up-to-date.
Stakeholder Training: A final walkthrough to ensure your team knows exactly how to navigate and interpret the results.
Why Choose This Service?
In a world of "data overload," clarity is power. I bridge the gap between technical data architecture and executive-level storytelling. My goal is to ensure that when you look at a dashboard, the "so what?" is immediately obvious.
Let’s stop guessing and start measuring. Ready to see your data in a whole new light?
Usamah W's other services

Starting at$400
Duration3 days
Tags
Google Sheets
Looker Studio
Microsoft Excel
Microsoft Power BI
Tableau
Service provided by
Usamah W Maphumulo Johannesburg, South Africa
- 2
- Followers
Data Visualization & Business Intelligence DashboardsUsamah W Maphumulo
Starting at$400
Duration3 days
Tags
Google Sheets
Looker Studio
Microsoft Excel
Microsoft Power BI
Tableau
Turn your raw data into a competitive advantage. I provide end-to-end data visualization services designed to transform complex datasets into intuitive, high-impact dashboards that drive faster, smarter decision-making.
Whether you are a startup looking to track KPIs or an established enterprise needing to unify disparate data sources, I specialize in building robust solutions across the industry’s leading BI platforms:
Looker Studio: Perfect for marketing performance tracking and seamless integration with Google Workspace and BigQuery.
Tableau: Ideal for deep-dive exploratory analysis, complex spatial data, and high-performance visual storytelling.
Power BI: The gold standard for organizations within the Microsoft ecosystem, offering powerful DAX modeling and seamless Excel integration.
What’s Included:
Data Strategy & Cleaning: I don’t just build charts; I ensure your data is accurate, structured, and "dashboard-ready."
Custom Visualizations: Bespoke charts, heatmaps, and trend lines tailored to your specific industry metrics.
Interactive Filters: Drill-down capabilities that allow you to explore data by date range, region, or product category.
Automated Refreshing: Set-it-and-forget-it automation so your reports are always up-to-date.
Stakeholder Training: A final walkthrough to ensure your team knows exactly how to navigate and interpret the results.
Why Choose This Service?
In a world of "data overload," clarity is power. I bridge the gap between technical data architecture and executive-level storytelling. My goal is to ensure that when you look at a dashboard, the "so what?" is immediately obvious.
Let’s stop guessing and start measuring. Ready to see your data in a whole new light?
Usamah W's other services
$400