
Insightful Data Visualization SolutionsAwais Anjum
Our Data Visualization Service helps businesses transform complex data into clear, actionable visuals. We create interactive dashboards, custom reports, and engaging presentations designed to simplify insights and support informed decision-making. Using advanced tools like Power BI and Microsoft Excel, we deliver visually compelling charts, graphs, and infographics that highlight key trends and performance metrics. Whether you need a real-time dashboard or a comprehensive report, our service ensures your data is easy to understand and accessible to all stakeholders.
What's included
Custom Data Visualization Reports
Interactive Data Dashboards
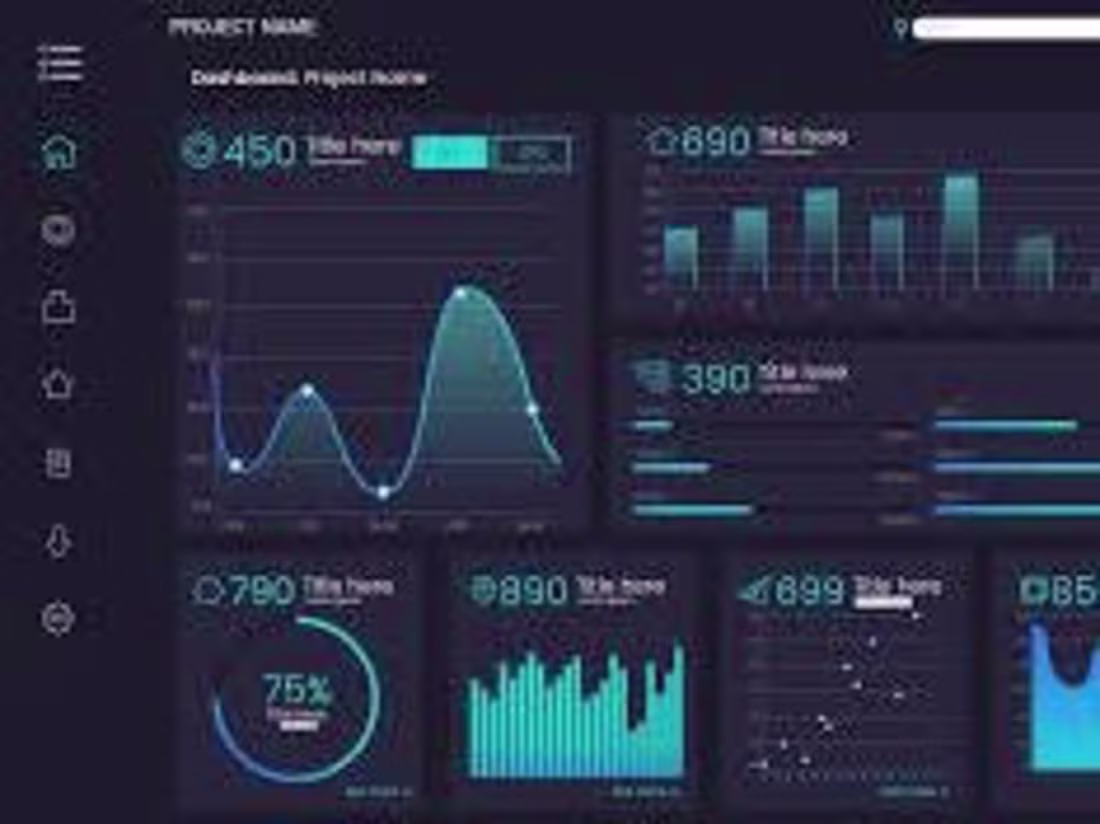
A dynamic, user-friendly dashboard that allows stakeholders to explore key metrics and insights in real-time. The dashboard includes customizable visuals such as graphs, charts, and maps, designed to aid decision-making and provide instant access to the most relevant data.
Custom Data Visualization Reports
Professionally designed reports featuring tailored visualizations that simplify complex data. These reports include charts, tables, and graphs, providing a comprehensive overview of findings with clear, actionable insights.
Visual Insights Presentation
A presentation deck that conveys key findings from data analysis through engaging visuals, making it easier for non-technical stakeholders to understand the results. The deck includes high-quality visual representations such as infographics, trend analysis, and comparisons.
Data Analysis Visualizations
A collection of charts and graphs that represent data analysis results in a visually compelling way. These visualizations are designed to highlight patterns, trends, and insights.
Business Intelligence Visual Reports
Comprehensive business intelligence reports incorporating advanced visualizations like heatmaps, line graphs, and pie charts to represent KPIs, trends, and other business metrics. These reports are interactive and offer in-depth insights into performance and operational efficiency.
FAQs
Awais's other services
Starting at$99.99 /wk
Tags
Microsoft Excel
Microsoft Power BI
Tableau
Data Analyst
Data Scientist
Data Visualizer
Service provided by
Awais Anjum Karachi, Pakistan
Insightful Data Visualization SolutionsAwais Anjum
Starting at$99.99 /wk
Tags
Microsoft Excel
Microsoft Power BI
Tableau
Data Analyst
Data Scientist
Data Visualizer
Our Data Visualization Service helps businesses transform complex data into clear, actionable visuals. We create interactive dashboards, custom reports, and engaging presentations designed to simplify insights and support informed decision-making. Using advanced tools like Power BI and Microsoft Excel, we deliver visually compelling charts, graphs, and infographics that highlight key trends and performance metrics. Whether you need a real-time dashboard or a comprehensive report, our service ensures your data is easy to understand and accessible to all stakeholders.
What's included
Custom Data Visualization Reports
Interactive Data Dashboards
A dynamic, user-friendly dashboard that allows stakeholders to explore key metrics and insights in real-time. The dashboard includes customizable visuals such as graphs, charts, and maps, designed to aid decision-making and provide instant access to the most relevant data.
Custom Data Visualization Reports
Professionally designed reports featuring tailored visualizations that simplify complex data. These reports include charts, tables, and graphs, providing a comprehensive overview of findings with clear, actionable insights.
Visual Insights Presentation
A presentation deck that conveys key findings from data analysis through engaging visuals, making it easier for non-technical stakeholders to understand the results. The deck includes high-quality visual representations such as infographics, trend analysis, and comparisons.
Data Analysis Visualizations
A collection of charts and graphs that represent data analysis results in a visually compelling way. These visualizations are designed to highlight patterns, trends, and insights.
Business Intelligence Visual Reports
Comprehensive business intelligence reports incorporating advanced visualizations like heatmaps, line graphs, and pie charts to represent KPIs, trends, and other business metrics. These reports are interactive and offer in-depth insights into performance and operational efficiency.
FAQs
Awais's other services
$99.99 /wk