
Data analyst and visualization expert with over 5 years of exp.Efe Harding
As a Data Analyst and Visualization Expert with over 5 years of experience, I specialize in transforming complex data into actionable insights using Google Sheets, Power BI, Looker Studio etc. I craft interactive dashboards that drive decision making, from sales trends to customer insights. Let’s me your data into a compelling story contact me to elevate your business with clear, impactful visualizations.
What's included
Data Cleaning and Preparation
Cleaning the raw datasets with documentation, ensuring accuracy and consistency.
Interactive Dashboards
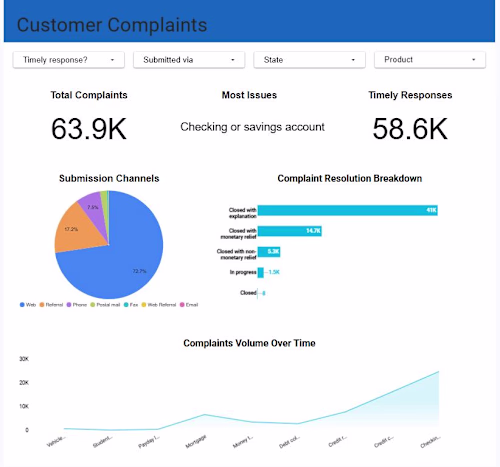
Custom dashboards in tools like Power BI, Looker Studio, or Google Sheets, featuring charts, slicers, and KPIs (e.g., sales trends, complaint volumes).
Reports and Insights
Detailed reports with visualizations (e.g., bar charts, pie charts).
Presentations
Visual summaries (e.g., PowerPoint or PDF) for stakeholders, highlighting key metrics.
Example work

Starting at$10 /hr
Tags
Google Sheets
Looker Studio
Microsoft Excel
Microsoft Power BI
SQL
Data Analyst
Data Scientist
Data Visualizer
Service provided by
Efe Harding Ebute Leki 105101, Nigeria
Data analyst and visualization expert with over 5 years of exp.Efe Harding
Starting at$10 /hr
Tags
Google Sheets
Looker Studio
Microsoft Excel
Microsoft Power BI
SQL
Data Analyst
Data Scientist
Data Visualizer
As a Data Analyst and Visualization Expert with over 5 years of experience, I specialize in transforming complex data into actionable insights using Google Sheets, Power BI, Looker Studio etc. I craft interactive dashboards that drive decision making, from sales trends to customer insights. Let’s me your data into a compelling story contact me to elevate your business with clear, impactful visualizations.
What's included
Data Cleaning and Preparation
Cleaning the raw datasets with documentation, ensuring accuracy and consistency.
Interactive Dashboards
Custom dashboards in tools like Power BI, Looker Studio, or Google Sheets, featuring charts, slicers, and KPIs (e.g., sales trends, complaint volumes).
Reports and Insights
Detailed reports with visualizations (e.g., bar charts, pie charts).
Presentations
Visual summaries (e.g., PowerPoint or PDF) for stakeholders, highlighting key metrics.
Example work
$10 /hr