
Data Analysis, Visualization & Insights using Python & Power BiAmeer gul
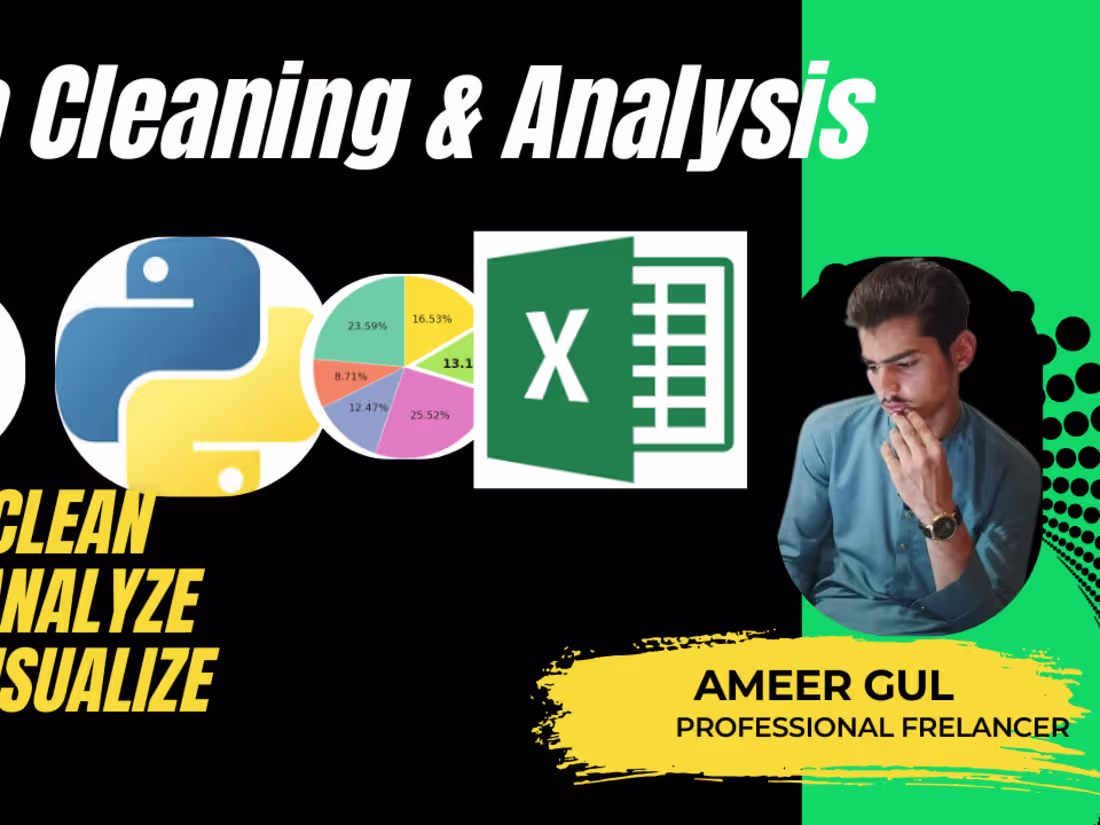
I provide professional data analysis services to help businesses turn raw data into clear, actionable insights. Using tools like Tableau, Matplotlib, and D3.js, I deliver clean datasets, detailed analysis reports, and interactive dashboards. My focus is on accuracy, clarity, and creating visualizations that make complex data easy to understand.
What's included
Interactive Visual Dashboard
Custom-built dashboard in Tableau/Matplotlib/D3.js for easy data exploration and decision-making.
Data Analysis Report
Comprehensive analysis with key metrics, patterns, and actionable business insights.
Cleaned & Structured Dataset
Raw data cleaned, formatted, and prepared for analysis, ensuring accuracy and consistency.
FAQs
Example work


Ameer's other services

Starting at$50
Duration3 days
Tags
Jupyter
Matplotlib
Microsoft Power BI
Python
seaborn
Data Analyst
Data Scientist
Data Visualizer
Service provided by
Ameer gul Islamabad, Pakistan
Data Analysis, Visualization & Insights using Python & Power BiAmeer gul
Starting at$50
Duration3 days
Tags
Jupyter
Matplotlib
Microsoft Power BI
Python
seaborn
Data Analyst
Data Scientist
Data Visualizer
I provide professional data analysis services to help businesses turn raw data into clear, actionable insights. Using tools like Tableau, Matplotlib, and D3.js, I deliver clean datasets, detailed analysis reports, and interactive dashboards. My focus is on accuracy, clarity, and creating visualizations that make complex data easy to understand.
What's included
Interactive Visual Dashboard
Custom-built dashboard in Tableau/Matplotlib/D3.js for easy data exploration and decision-making.
Data Analysis Report
Comprehensive analysis with key metrics, patterns, and actionable business insights.
Cleaned & Structured Dataset
Raw data cleaned, formatted, and prepared for analysis, ensuring accuracy and consistency.
FAQs
Example work
Ameer's other services
$50