
📊 Custom Dashboard or Report in Power BI or ExcelLaquita Simmons
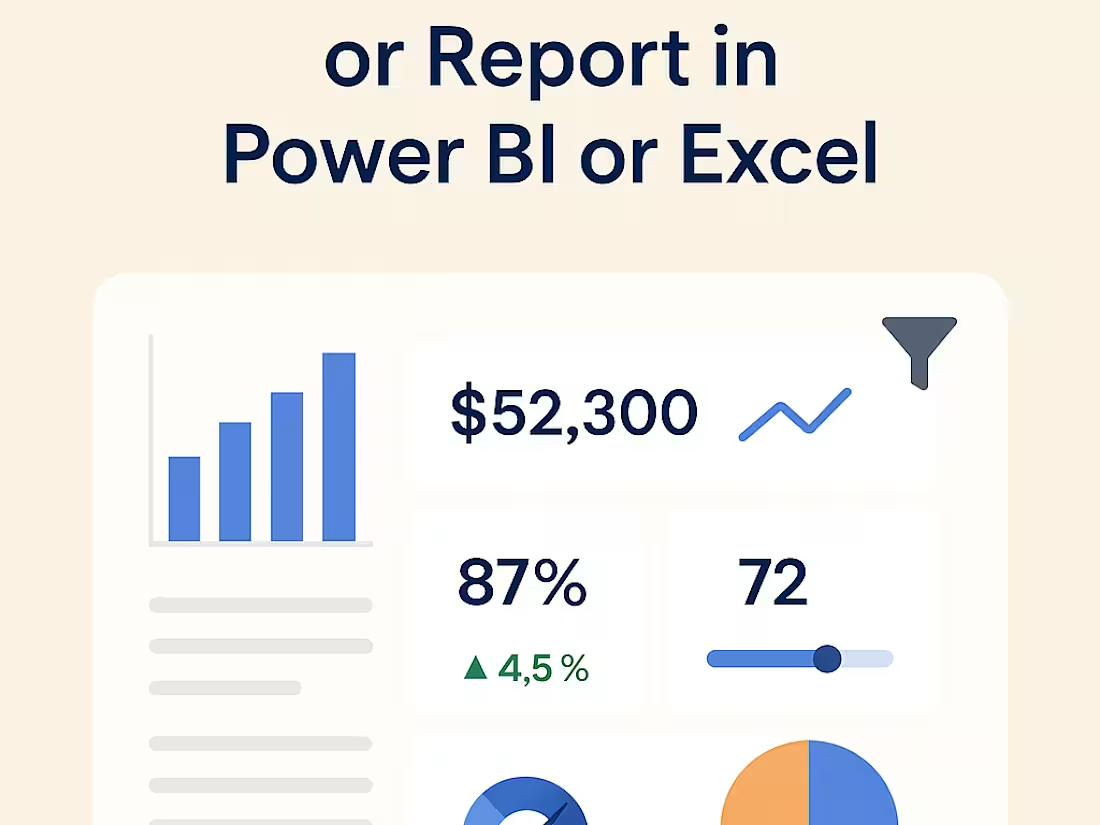
I create tailored dashboards in Power BI or Excel that turn messy data into meaningful insights. With a strong eye for storytelling and a hands-on approach to data cleaning, I help founders, educators, and clinicians see exactly what matters—clearly, quickly, and beautifully.
What's included
📊 Custom Dashboard or Report in Power BI or Excel
I will create a fully customized Power BI or Excel dashboard that helps you clearly track and understand your business metrics. Whether you need to analyze product sales, student performance, or healthcare trends — I’ll turn your raw data into clear, interactive visuals and summaries.
🔹 Includes:
One dashboard/report (Power BI or Excel)
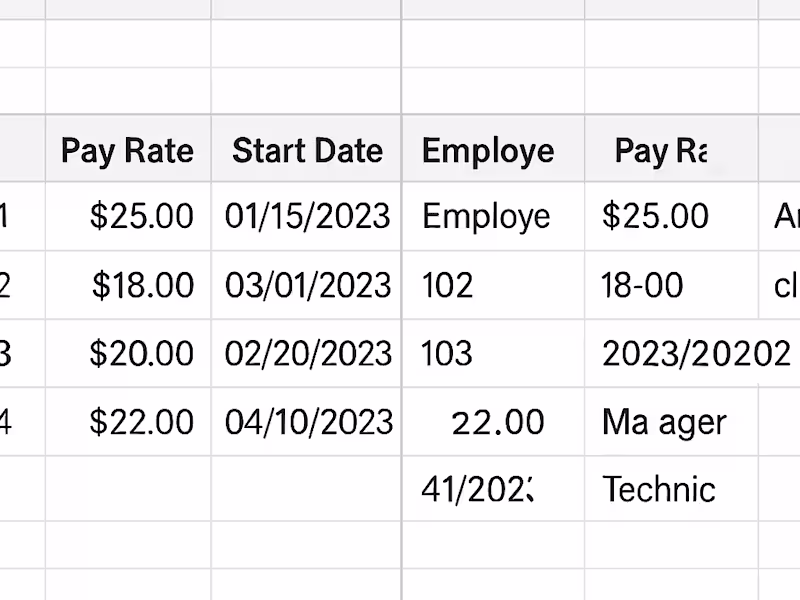
Data cleaning & transformation
Basic KPI setup
Filtering by date, category, or custom fields
🛠️ Tools I use: Power BI, Excel, SQL
Perfect for e-commerce sellers, educators, clinics, or founders who want quick, clean insights.
FAQs

Starting at$85
Duration4 days
Tags
MATLAB
Microsoft Excel
pandas
Tableau
Data Analyst
Data Modelling Analyst
Data Scientist
Service provided by
Laquita Simmons Pine Bluff, USA
- 2
- Followers
📊 Custom Dashboard or Report in Power BI or ExcelLaquita Simmons
Starting at$85
Duration4 days
Tags
MATLAB
Microsoft Excel
pandas
Tableau
Data Analyst
Data Modelling Analyst
Data Scientist
I create tailored dashboards in Power BI or Excel that turn messy data into meaningful insights. With a strong eye for storytelling and a hands-on approach to data cleaning, I help founders, educators, and clinicians see exactly what matters—clearly, quickly, and beautifully.
What's included
📊 Custom Dashboard or Report in Power BI or Excel
I will create a fully customized Power BI or Excel dashboard that helps you clearly track and understand your business metrics. Whether you need to analyze product sales, student performance, or healthcare trends — I’ll turn your raw data into clear, interactive visuals and summaries.
🔹 Includes:
One dashboard/report (Power BI or Excel)
Data cleaning & transformation
Basic KPI setup
Filtering by date, category, or custom fields
🛠️ Tools I use: Power BI, Excel, SQL
Perfect for e-commerce sellers, educators, clinics, or founders who want quick, clean insights.
FAQs
$85