
I will Build reusable streamlit dashboard from your csv or exclRozina Begum
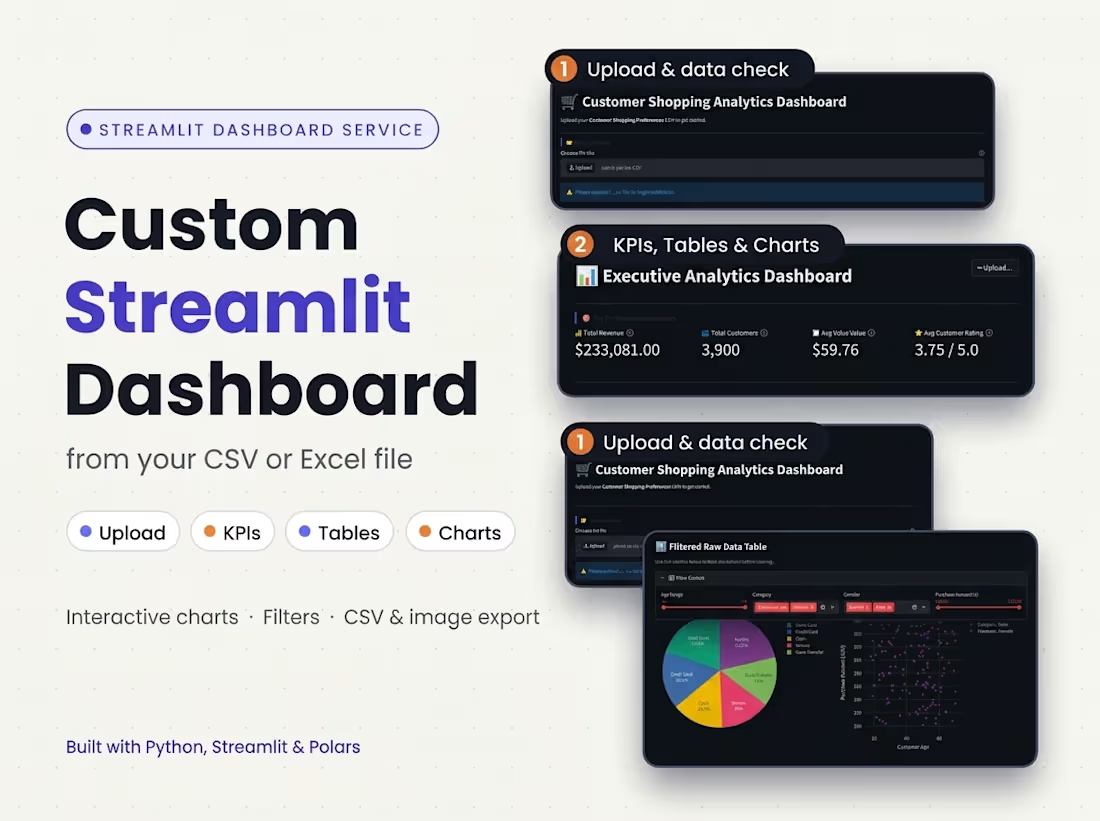
I will build a reusable, high-speed Streamlit web dashboard for your CSV or Excel files. Instead of building a new dashboard every time your data changes, you get an app with a built-in upload box—just drop your updated file anytime, and your live report updates automatically!
How It Works:
The dashboard is custom-built for your specific file structure. Whenever you upload a new file with the same columns, it automatically checks the data (rows, columns, missing values). If the format doesn't match, it instantly shows a clear error message. Otherwise, it generates fresh insights in seconds using Polars (for ultra-fast processing and low RAM usage) and Plotly (for interactive visuals).
What You Get:
Upload Box: Drag-and-drop CSV/Excel upload with instant data validation.
KPIs & Filters: Up to 4 key numbers at the top, plus dropdown filters (by month, category, or team).
Table & Visual Tabs: Clean data table with CSV export, and up to 6 interactive Plotly charts (with image download).
Full Handover: Clean source code and a simple setup guide.
What I Need From You:
A sample CSV or Excel file (1 sheet, 50–150 MB max) with your exact column names.
The key numbers and charts you want to track.
(Note: Includes basic data cleaning and up to 3 revisions. Need a live database connection or multi-page app instead? Check out my database dashboard service or message me directly!)
🎥 Sample: Check out "Customer Shopping Insights Dashboard" on my profile to see a live video of this system in action link "https://contra.com/p/eMMoPoMs-customer-shopping-insights-dashboard-a-fast "
FAQs
Example work

Starting at$120
Duration3 days
Tags
Dash Plotly

Python

Streamlit

Dashboard
Data Analyst
Web Developer
Data
dashboard
Polars
Service provided by
Rozina Begum Dhaka, Bangladesh
I will Build reusable streamlit dashboard from your csv or exclRozina Begum
Starting at$120
Duration3 days
Tags
Dash Plotly
Python
Streamlit
Dashboard
Data Analyst
Web Developer
Data
dashboard
Polars
I will build a reusable, high-speed Streamlit web dashboard for your CSV or Excel files. Instead of building a new dashboard every time your data changes, you get an app with a built-in upload box—just drop your updated file anytime, and your live report updates automatically!
How It Works:
The dashboard is custom-built for your specific file structure. Whenever you upload a new file with the same columns, it automatically checks the data (rows, columns, missing values). If the format doesn't match, it instantly shows a clear error message. Otherwise, it generates fresh insights in seconds using Polars (for ultra-fast processing and low RAM usage) and Plotly (for interactive visuals).
What You Get:
Upload Box: Drag-and-drop CSV/Excel upload with instant data validation.
KPIs & Filters: Up to 4 key numbers at the top, plus dropdown filters (by month, category, or team).
Table & Visual Tabs: Clean data table with CSV export, and up to 6 interactive Plotly charts (with image download).
Full Handover: Clean source code and a simple setup guide.
What I Need From You:
A sample CSV or Excel file (1 sheet, 50–150 MB max) with your exact column names.
The key numbers and charts you want to track.
(Note: Includes basic data cleaning and up to 3 revisions. Need a live database connection or multi-page app instead? Check out my database dashboard service or message me directly!)
🎥 Sample: Check out "Customer Shopping Insights Dashboard" on my profile to see a live video of this system in action link "https://contra.com/p/eMMoPoMs-customer-shopping-insights-dashboard-a-fast "
FAQs
Example work
$120