
Create custom charts and graphs with Python and MatplotlibPersia Cooper
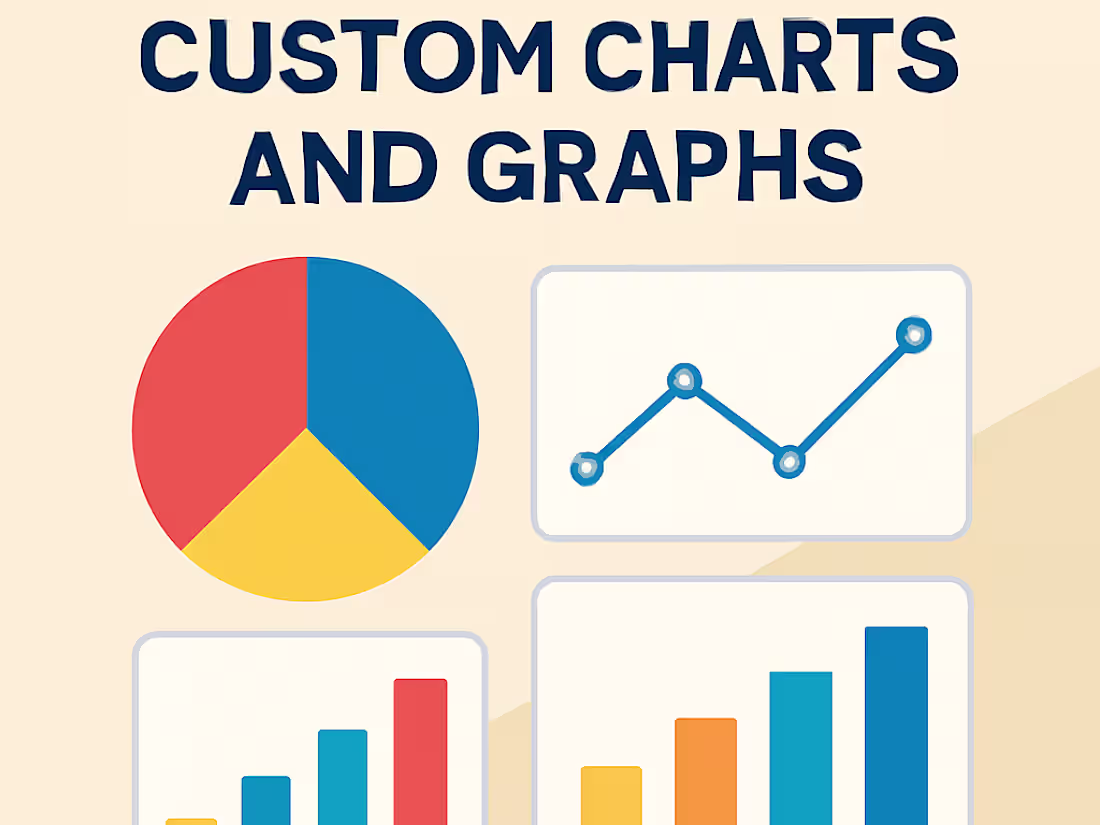
I will design and create custom data visualizations using Python and Matplotlib tailored to your dataset and needs, helping you communicate insights clearly and professionally.
What's included
Custom charts and graphs in PNG/JPEG or PDF format
High-quality, customized charts and graphs created using Python and Matplotlib, delivered in your preferred format (PNG, JPEG, or PDF), perfect for reports, presentations, or dashboards.
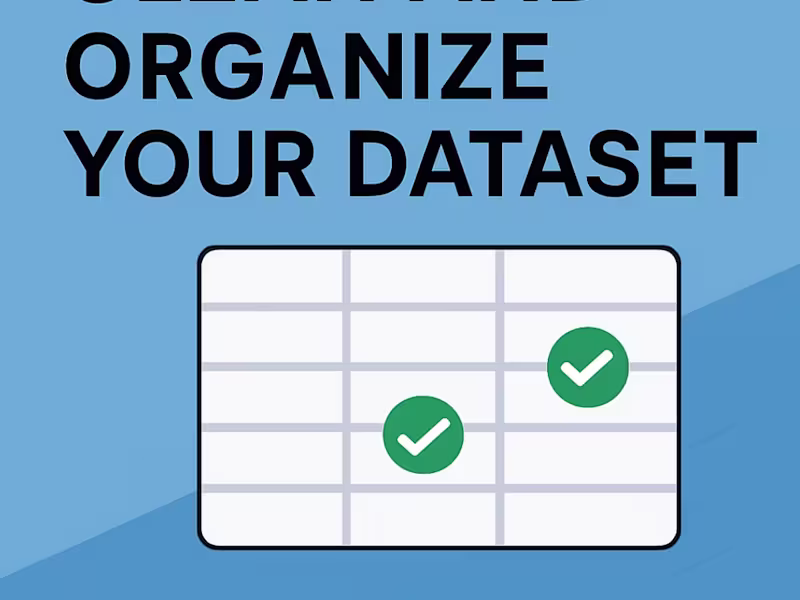
Example work
Persia's other services
Starting at$5
Duration1 day
Tags
MATLAB
Microsoft Excel
pandas
Data Analyst
Data Visualizer
Graphic Designer
Service provided by
Persia Cooper Naples, USA
Create custom charts and graphs with Python and MatplotlibPersia Cooper
Starting at$5
Duration1 day
Tags
MATLAB
Microsoft Excel
pandas
Data Analyst
Data Visualizer
Graphic Designer
I will design and create custom data visualizations using Python and Matplotlib tailored to your dataset and needs, helping you communicate insights clearly and professionally.
What's included
Custom charts and graphs in PNG/JPEG or PDF format
High-quality, customized charts and graphs created using Python and Matplotlib, delivered in your preferred format (PNG, JPEG, or PDF), perfect for reports, presentations, or dashboards.
Example work
Persia's other services
$5