
Visualize your Data through MS Excel with amazing dashboards!Shruti Dharashiokar
I will assist with creating data visualizations in Excel, including charts, graphs, and basic dashboards to help present your data clearly. Whether you need reports, trend analysis, or performance tracking, I’ll design visuals that make your data easy to understand and actionable.
What's included
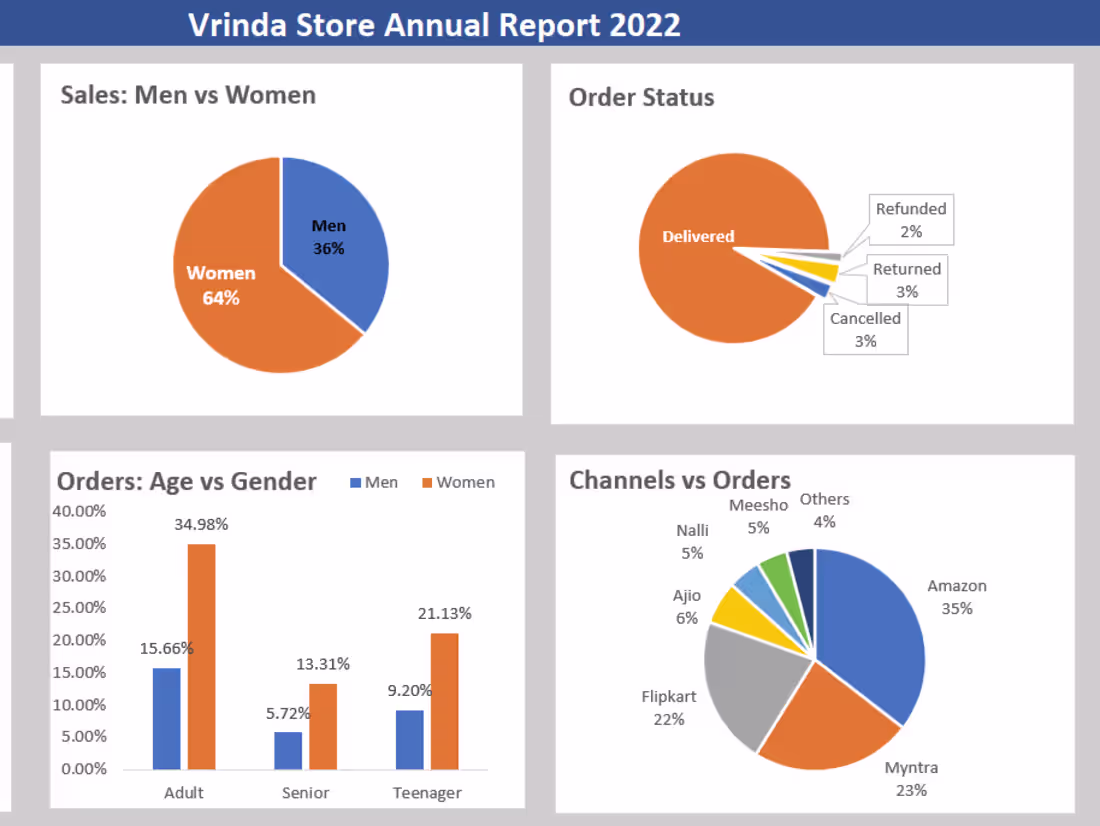
Dashboards, but is MS Excel!
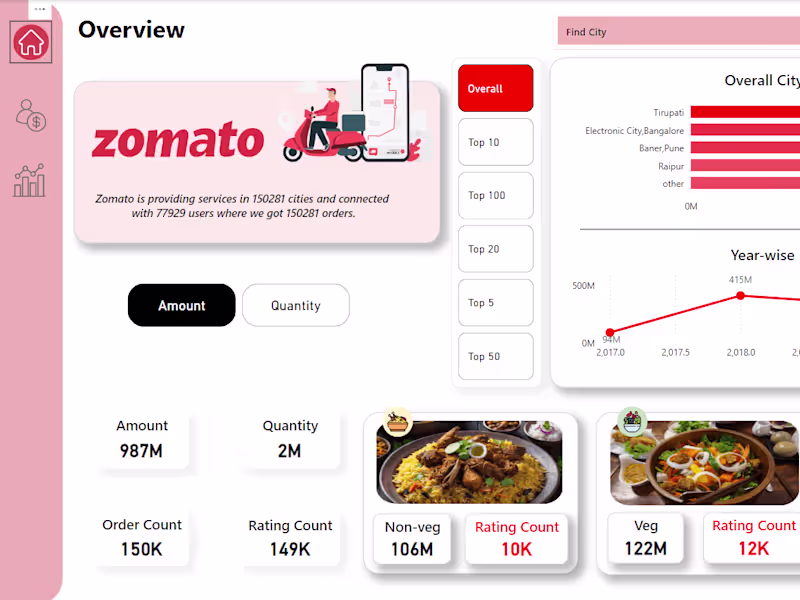
I can help you create professional visualizations in Excel. While I'm still gaining experience with Excel dashboards, my intermediate Power BI skills make it easier for me to craft effective and insightful visuals. Let’s bring your data to life!
Shruti's other services
Contact for pricing
Tags
Microsoft Excel
Data Analyst
Data Visualizer
Service provided by
Shruti Dharashiokar Mumbai, India
Visualize your Data through MS Excel with amazing dashboards!Shruti Dharashiokar
Contact for pricing
Tags
Microsoft Excel
Data Analyst
Data Visualizer
I will assist with creating data visualizations in Excel, including charts, graphs, and basic dashboards to help present your data clearly. Whether you need reports, trend analysis, or performance tracking, I’ll design visuals that make your data easy to understand and actionable.
What's included
Dashboards, but is MS Excel!
I can help you create professional visualizations in Excel. While I'm still gaining experience with Excel dashboards, my intermediate Power BI skills make it easier for me to craft effective and insightful visuals. Let’s bring your data to life!
Shruti's other services
Contact for pricing