
Data VisualizationBoborol, Marcel Angelo
The objective is to utilize data analysis and visualization techniques to tackle specific business challenges. Using tools like Jupyter Notebook, Python, and Excel alongside libraries such as Pandas, Matplotlib, and Seaborn, we collect, clean, and analyze best-sellers data to identify key trends and patterns. The impact of this process includes delivering critical insights that guide business administration decisions, empowering stakeholders to optimize inventory management and marketing strategies based on a comprehensive understanding of sales trends and patterns.
What's included
Interactive Data Visualization Dashboard
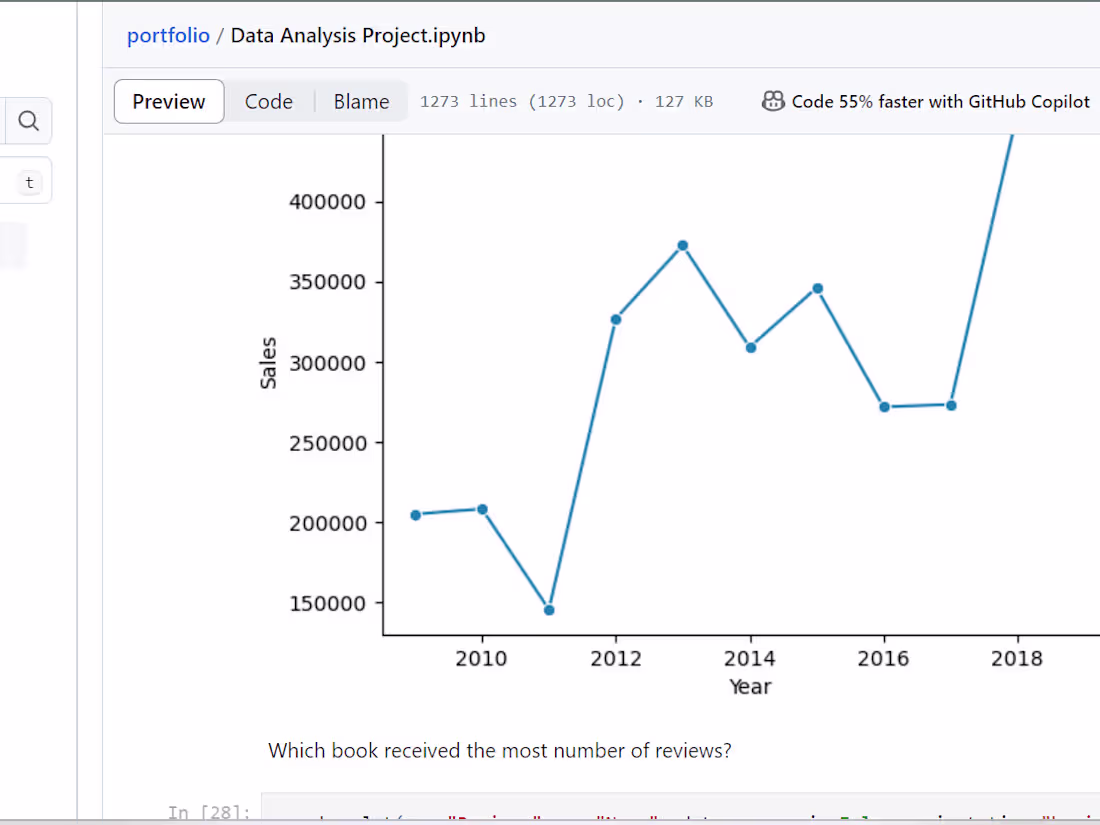
Our data visualization service provides an interactive dashboard that transforms complex datasets into visually compelling insights. Utilizing advanced techniques and tools such as Python's Matplotlib and Seaborn libraries, we create dynamic visualizations that enable users to explore and understand data with ease. From interactive charts and graphs to customizable filters and drill-down capabilities, our dashboard enhances decision-making processes by presenting information in a clear and actionable format. Whether it's analyzing sales trends, tracking key performance indicators, or understanding customer behavior, our data visualization service empowers businesses to unlock the full potential of their data.
Boborol,'s other services
Contact for pricing
Tags
Jupyter
Matplotlib
pandas
Data Analyst
Data Scientist
Data Visualizer
Service provided by
Boborol, Marcel Angelo Caloocan, Philippines
Data VisualizationBoborol, Marcel Angelo
Contact for pricing
Tags
Jupyter
Matplotlib
pandas
Data Analyst
Data Scientist
Data Visualizer
The objective is to utilize data analysis and visualization techniques to tackle specific business challenges. Using tools like Jupyter Notebook, Python, and Excel alongside libraries such as Pandas, Matplotlib, and Seaborn, we collect, clean, and analyze best-sellers data to identify key trends and patterns. The impact of this process includes delivering critical insights that guide business administration decisions, empowering stakeholders to optimize inventory management and marketing strategies based on a comprehensive understanding of sales trends and patterns.
What's included
Interactive Data Visualization Dashboard
Our data visualization service provides an interactive dashboard that transforms complex datasets into visually compelling insights. Utilizing advanced techniques and tools such as Python's Matplotlib and Seaborn libraries, we create dynamic visualizations that enable users to explore and understand data with ease. From interactive charts and graphs to customizable filters and drill-down capabilities, our dashboard enhances decision-making processes by presenting information in a clear and actionable format. Whether it's analyzing sales trends, tracking key performance indicators, or understanding customer behavior, our data visualization service empowers businesses to unlock the full potential of their data.
Boborol,'s other services
Contact for pricing