
Design Enterprise-level Tableau Reports and DashboardsSamuel Apanisile
I design high impact Tableau dashboards that transform complex data into clear, actionable insights. My approach focuses on dashboard as a decision-tool not just a bunch of charts, enhanced by intuitive user experience, and custom branding to ensure your reports are not only visually compelling but also efficient and easy to use. With expertise in data storytelling and UX best practices, I deliver dashboards that empower decision-making while maintaining scalability for growing data needs.
What's included
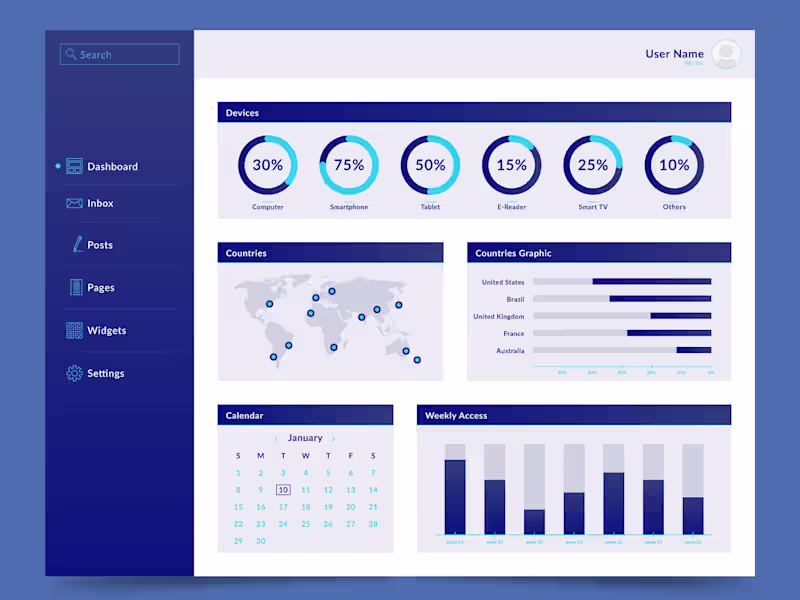
High-Impact Interactive Tableau Dashboard
A fully designed and functional dashboard tailored to business needs highlighting charts, KPIs, and graphs optimized for clear insights.
Dynamic Filters & Parameters
User-friendly controls for deeper data exploration.
Dashboard UX Optimization
Clean, intuitive layout with responsive design principles. Incorporation of company logos, colors, and styles.
Automated Data Refresh Setup
Guidance on refreshing data efficiently.
Performance Optimization
Efficient calculations, optimized extracts, and best practices for speed.
Tableau Workbook (.twbx/.twb)
Packaged or live connection workbook files.
Documentation & User Guide (Optional)
Video demo or written instructions on navigating and using the dashboard.
Samuel's other services
Contact for pricing
Tags
Figma
Microsoft Office 365
Microsoft SQL Server
Tableau
Zoom
Data Analyst
Data Engineer
Data Visualizer
Service provided by
Samuel Apanisile Jos, Nigeria
Design Enterprise-level Tableau Reports and DashboardsSamuel Apanisile
Contact for pricing
Tags
Figma
Microsoft Office 365
Microsoft SQL Server
Tableau
Zoom
Data Analyst
Data Engineer
Data Visualizer
I design high impact Tableau dashboards that transform complex data into clear, actionable insights. My approach focuses on dashboard as a decision-tool not just a bunch of charts, enhanced by intuitive user experience, and custom branding to ensure your reports are not only visually compelling but also efficient and easy to use. With expertise in data storytelling and UX best practices, I deliver dashboards that empower decision-making while maintaining scalability for growing data needs.
What's included
High-Impact Interactive Tableau Dashboard
A fully designed and functional dashboard tailored to business needs highlighting charts, KPIs, and graphs optimized for clear insights.
Dynamic Filters & Parameters
User-friendly controls for deeper data exploration.
Dashboard UX Optimization
Clean, intuitive layout with responsive design principles. Incorporation of company logos, colors, and styles.
Automated Data Refresh Setup
Guidance on refreshing data efficiently.
Performance Optimization
Efficient calculations, optimized extracts, and best practices for speed.
Tableau Workbook (.twbx/.twb)
Packaged or live connection workbook files.
Documentation & User Guide (Optional)
Video demo or written instructions on navigating and using the dashboard.
Samuel's other services
Contact for pricing