
Time Series AnalysisKhal Ben
I offer comprehensive Time Series Analysis to help you unlock the full potential of your time-based data. My unique approach combines advanced statistical and machine learning, deep learning models with thorough data preparation and visualization techniques, ensuring accurate insights and forecasts tailored to your specific needs. With a focus on delivering actionable results, I provide custom forecasting models, interactive dashboards, and detailed reports to empower your decision-making.
What's included
Holistic time series analysis to identify trends, forecast future values, and gain valuable insights from your time series data.
What I Offer
1- Data Preparation: Address missing values, outliers, and inconsistencies to ensure accurate analysis.
2- Exploratory Data Analysis (EDA)
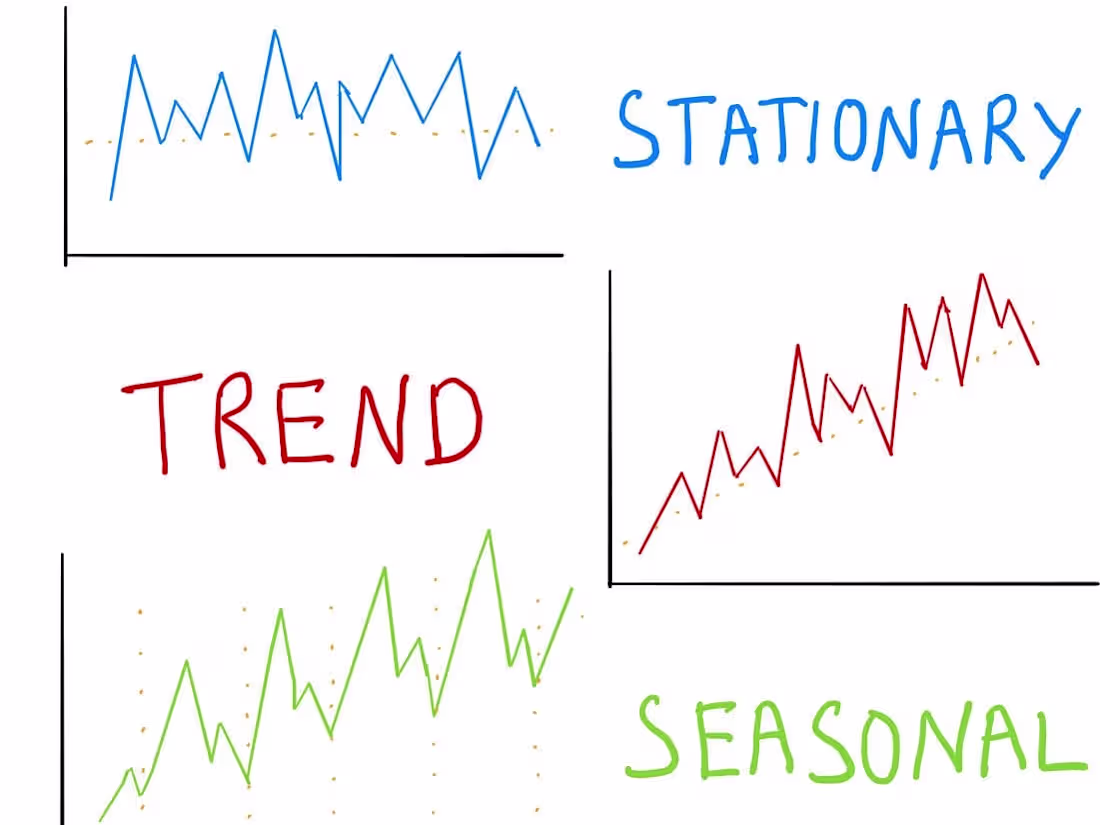
Trend Analysis: Detect long-term trends and patterns within your data.
Seasonality Detection: Identify periodic fluctuations and seasonal variations.
3- Modeling and Forecasting
Statistical Models: Apply ARIMA, SARIMA, and Exponential Smoothing for forecasting.
Machine Learning Models: Use techniques like Nhits, Nbeats, LSTM and Prophet for advanced forecasting.
Model Evaluation: Validate model accuracy with cross-validation and error metrics.
4- Anomaly Detection
Irregularities: Identify and analyze unusual patterns or outliers in your data.
Visualization and Reporting
Charts and Graphs: Create dynamic visualizations to display trends, forecasts, and anomalies.
Reports: Provide a detailed summary of findings, models used, and actionable insights.
Deliverables
Forecasting Models: Custom models for predicting future values based on your data.
Visualization Dashboards: Interactive charts and graphs showing trends and forecasts.
Analysis Report: A comprehensive report including methodologies, findings, and insights.
FAQs
Khal's other services

Contact for pricing
Tags
ggplot2
Matplotlib
pandas
Python
R
Data Analyst
Data Modelling Analyst
Data Scientist
Service provided by
Khal Ben Tangier, Morocco
- 1
- Followers
Time Series AnalysisKhal Ben
Contact for pricing
Tags
ggplot2
Matplotlib
pandas
Python
R
Data Analyst
Data Modelling Analyst
Data Scientist
I offer comprehensive Time Series Analysis to help you unlock the full potential of your time-based data. My unique approach combines advanced statistical and machine learning, deep learning models with thorough data preparation and visualization techniques, ensuring accurate insights and forecasts tailored to your specific needs. With a focus on delivering actionable results, I provide custom forecasting models, interactive dashboards, and detailed reports to empower your decision-making.
What's included
Holistic time series analysis to identify trends, forecast future values, and gain valuable insights from your time series data.
What I Offer
1- Data Preparation: Address missing values, outliers, and inconsistencies to ensure accurate analysis.
2- Exploratory Data Analysis (EDA)
Trend Analysis: Detect long-term trends and patterns within your data.
Seasonality Detection: Identify periodic fluctuations and seasonal variations.
3- Modeling and Forecasting
Statistical Models: Apply ARIMA, SARIMA, and Exponential Smoothing for forecasting.
Machine Learning Models: Use techniques like Nhits, Nbeats, LSTM and Prophet for advanced forecasting.
Model Evaluation: Validate model accuracy with cross-validation and error metrics.
4- Anomaly Detection
Irregularities: Identify and analyze unusual patterns or outliers in your data.
Visualization and Reporting
Charts and Graphs: Create dynamic visualizations to display trends, forecasts, and anomalies.
Reports: Provide a detailed summary of findings, models used, and actionable insights.
Deliverables
Forecasting Models: Custom models for predicting future values based on your data.
Visualization Dashboards: Interactive charts and graphs showing trends and forecasts.
Analysis Report: A comprehensive report including methodologies, findings, and insights.
FAQs
Khal's other services
Contact for pricing