
Data Analytics & Visualization | Excel, SQL, Power BI, PythonRakibul Hasan Shanto
I offer professional data analysis and visualization services using tools like Excel, SQL, Power BI, and Python. I specialize in transforming raw data into actionable insights and creating visually compelling dashboards to drive informed decision-making. With a keen eye for detail and a focus on accuracy, I ensure your data tells a clear and impactful story, tailored to your business needs.
What's included
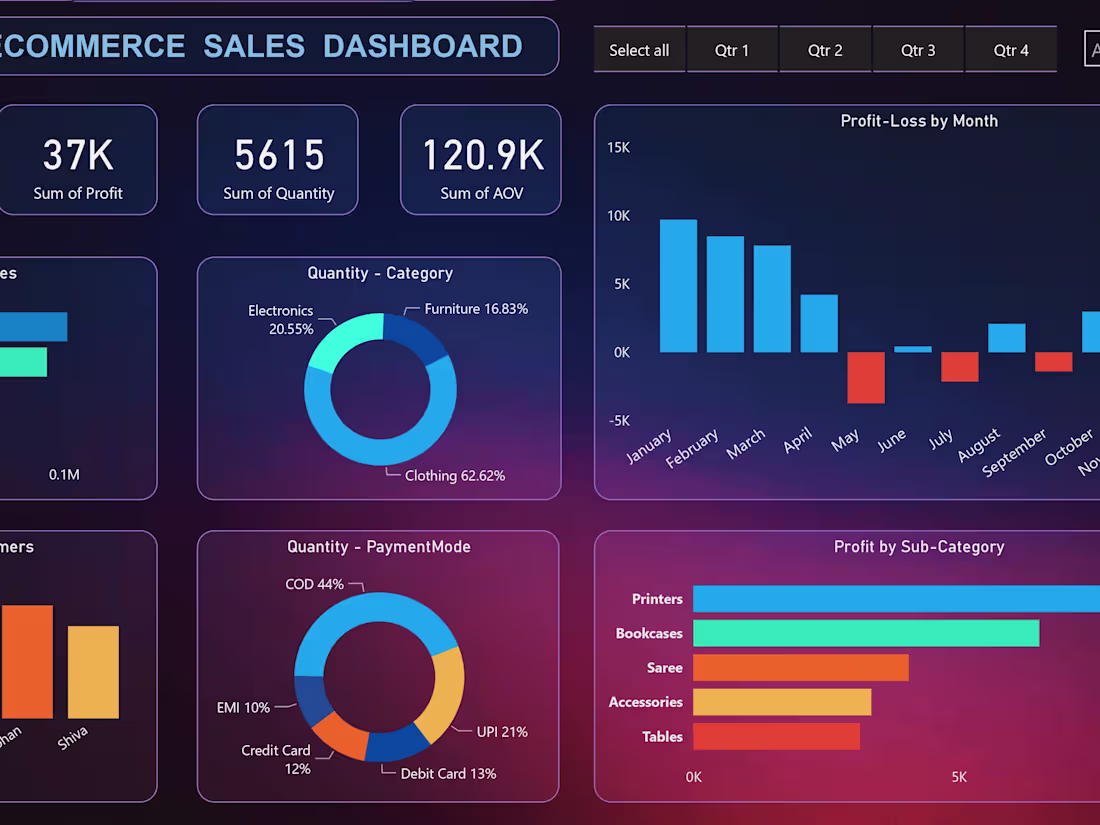
Data Visualization Dashboard
An interactive and insightful dashboard built using Power BI or Excel, presenting clear trends, KPIs, and actionable insights tailored to your business needs.
Rakibul Hasan's other services

Contact for pricing
Tags
MATLAB
Microsoft Excel
pandas
Tableau
Business Analyst
Data Analyst
Database Administrator
Service provided by
Rakibul Hasan Shanto Mirzapur, Bangladesh
Data Analytics & Visualization | Excel, SQL, Power BI, PythonRakibul Hasan Shanto
Contact for pricing
Tags
MATLAB
Microsoft Excel
pandas
Tableau
Business Analyst
Data Analyst
Database Administrator
I offer professional data analysis and visualization services using tools like Excel, SQL, Power BI, and Python. I specialize in transforming raw data into actionable insights and creating visually compelling dashboards to drive informed decision-making. With a keen eye for detail and a focus on accuracy, I ensure your data tells a clear and impactful story, tailored to your business needs.
What's included
Data Visualization Dashboard
An interactive and insightful dashboard built using Power BI or Excel, presenting clear trends, KPIs, and actionable insights tailored to your business needs.
Rakibul Hasan's other services
Contact for pricing