
Data Visualization | Uncovering Hidden Truths from BusinessesPedro Dittmar
I offer data visualization services that turn complex data into clear, actionable insights. With hands-on experience in early-stage startups, I understand business challenges deeply and think like a decision-maker. My background in economics, combined with technical skills in Python, SQL, and Looker Studio, enables me to apply rigorous analysis and eliminate noise, focusing on what drives impactful results for your business.
What's included
Interactive Dashboard
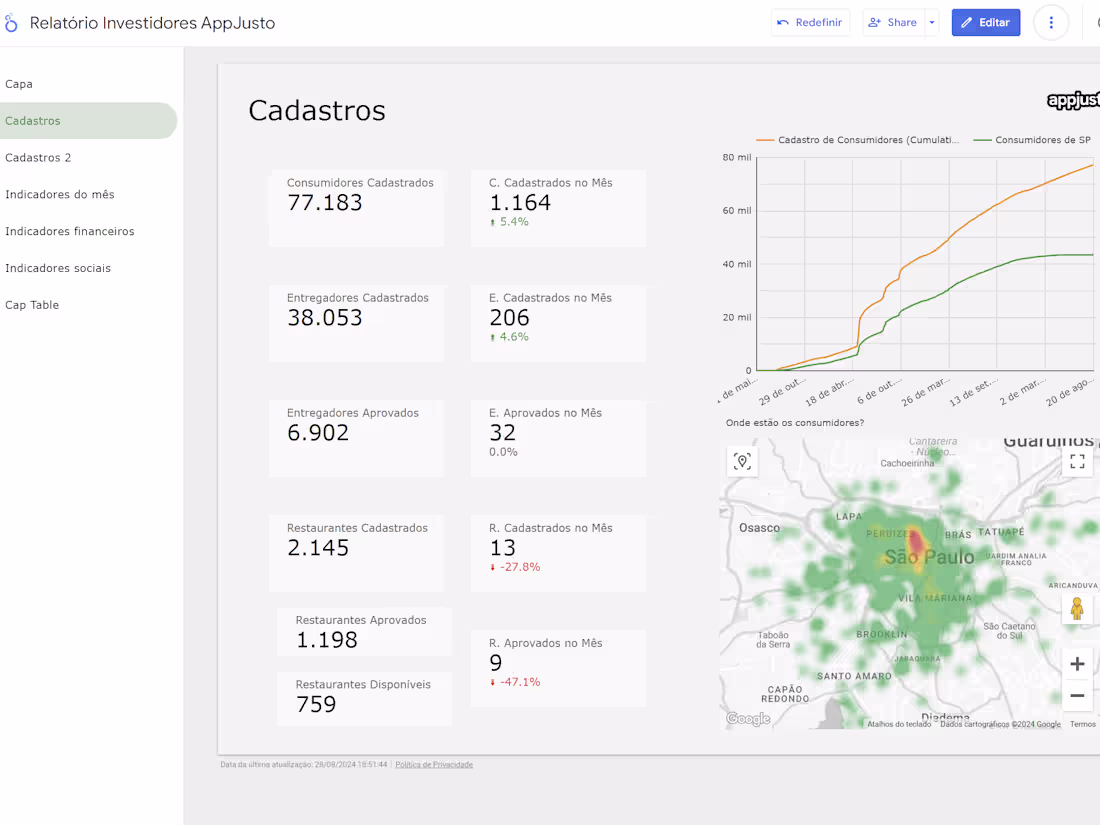
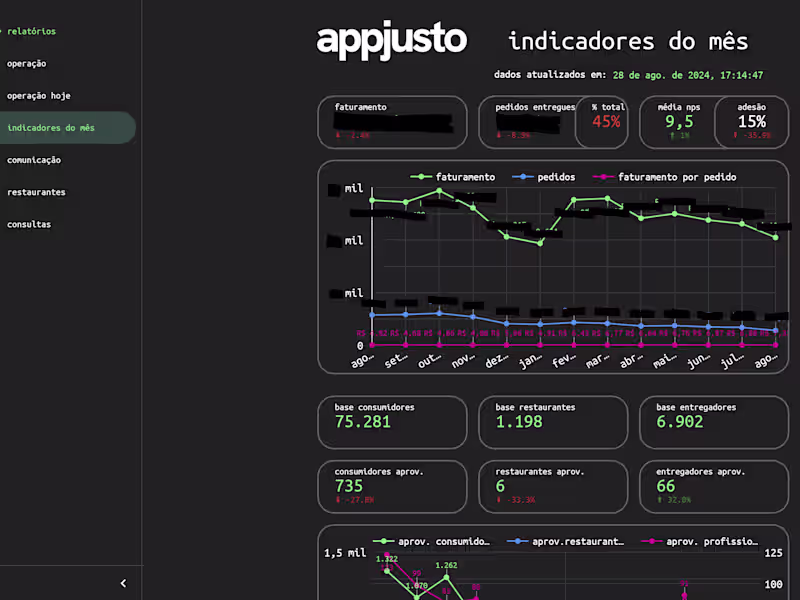
- An interactive dashboard with custom visualizations, designed to provide a clear view of key business metrics and trends. The dashboard will include filters, charts, and graphs to explore the data.
- Format: Google Looker Studio link (default). Power BI or Tableau link available if the client has a license.
- Includes up to 2 revisions based on feedback.
Visual Data Report
- A comprehensive report with static visuals (charts, graphs) and a narrative summary to support key findings. Tailored to present insights in an easily digestible format for stakeholders.
- Format: PDF and/or PowerPoint (depending on client preference).
- 1 revision included to refine visuals and content.
Insights Summary Presentation
- A concise presentation highlighting the most impactful insights discovered through the analysis. Includes strategic recommendations and action points for the business.
- Format: PowerPoint or Google Slides.
- 1 follow-up session and revision to discuss and incorporate additional insights or clarifications.
Pedro's other services
Contact for pricing
Tags
Looker
Matplotlib
Microsoft Power BI
seaborn
Tableau
Business Analyst
Data Analyst
Data Visualizer
Service provided by
Pedro Dittmar São Paulo, Brazil
Data Visualization | Uncovering Hidden Truths from BusinessesPedro Dittmar
Contact for pricing
Tags
Looker
Matplotlib
Microsoft Power BI
seaborn
Tableau
Business Analyst
Data Analyst
Data Visualizer
I offer data visualization services that turn complex data into clear, actionable insights. With hands-on experience in early-stage startups, I understand business challenges deeply and think like a decision-maker. My background in economics, combined with technical skills in Python, SQL, and Looker Studio, enables me to apply rigorous analysis and eliminate noise, focusing on what drives impactful results for your business.
What's included
Interactive Dashboard
- An interactive dashboard with custom visualizations, designed to provide a clear view of key business metrics and trends. The dashboard will include filters, charts, and graphs to explore the data.
- Format: Google Looker Studio link (default). Power BI or Tableau link available if the client has a license.
- Includes up to 2 revisions based on feedback.
Visual Data Report
- A comprehensive report with static visuals (charts, graphs) and a narrative summary to support key findings. Tailored to present insights in an easily digestible format for stakeholders.
- Format: PDF and/or PowerPoint (depending on client preference).
- 1 revision included to refine visuals and content.
Insights Summary Presentation
- A concise presentation highlighting the most impactful insights discovered through the analysis. Includes strategic recommendations and action points for the business.
- Format: PowerPoint or Google Slides.
- 1 follow-up session and revision to discuss and incorporate additional insights or clarifications.
Pedro's other services
Contact for pricing