
Chart CreationChetan Salmotra
I bring data to life with interactive charts built using JavaScript. I can craft charts that seamlessly integrate with various data sources and offer customization options for a perfect visual fit. My true strength lies in creating user-friendly charts with clear documentation, making it easy for anyone to integrate them into their projects.
What's included
Core Deliverables:
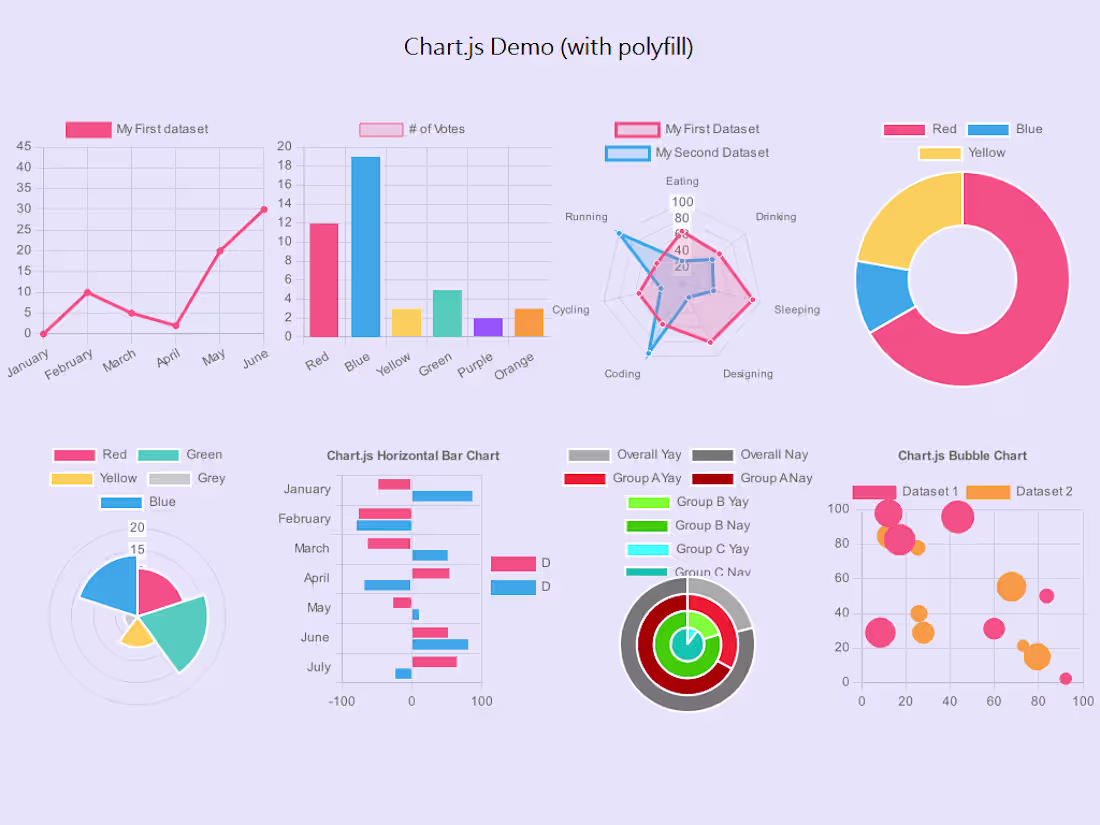
Interactive Chart: A functional chart component built with JavaScript that displays data visually. This should include:
Chart Library Selection: Choosing a suitable JavaScript charting library (e.g., Chart.js, D3.js) based on project requirements and complexity.
Data Source Integration: Ability to integrate with various data sources like JSON, CSV, or database connections.
Chart Type Selection: Implementations for different chart types like bar charts, line charts, pie charts, or scatter plots (depending on project needs).
Customization Options: Allow users to customize chart elements like colors, labels, legends, and tooltips.
Interactive Features: Implement features like zooming, panning, or data point highlighting on hover (optional, based on complexity).

Chart CreationChetan Salmotra
I bring data to life with interactive charts built using JavaScript. I can craft charts that seamlessly integrate with various data sources and offer customization options for a perfect visual fit. My true strength lies in creating user-friendly charts with clear documentation, making it easy for anyone to integrate them into their projects.
What's included
Core Deliverables:
Interactive Chart: A functional chart component built with JavaScript that displays data visually. This should include:
Chart Library Selection: Choosing a suitable JavaScript charting library (e.g., Chart.js, D3.js) based on project requirements and complexity.
Data Source Integration: Ability to integrate with various data sources like JSON, CSV, or database connections.
Chart Type Selection: Implementations for different chart types like bar charts, line charts, pie charts, or scatter plots (depending on project needs).
Customization Options: Allow users to customize chart elements like colors, labels, legends, and tooltips.
Interactive Features: Implement features like zooming, panning, or data point highlighting on hover (optional, based on complexity).
$30