
End-to-End Data Analysis with Reports & Dashboards in Power BI Rajendra Behera
I offer expert data analysis services using Python, SQL, Power BI, and Excel to transform raw data into actionable insights. With a focus on creating interactive dashboards, automated reports, and visualizations, I help businesses make data-driven decisions. My unique strength lies in delivering clear, insightful, and customized solutions tailored to your business needs.
What's included
Cleaned & Structured Data with Actionable Insights (Excel, SQL, Python)
📊 Excel Dashboard with Pivot Tables, Charts & Reports
📈 SQL-Based Data Extraction & Filterable Report in Excel/CSV
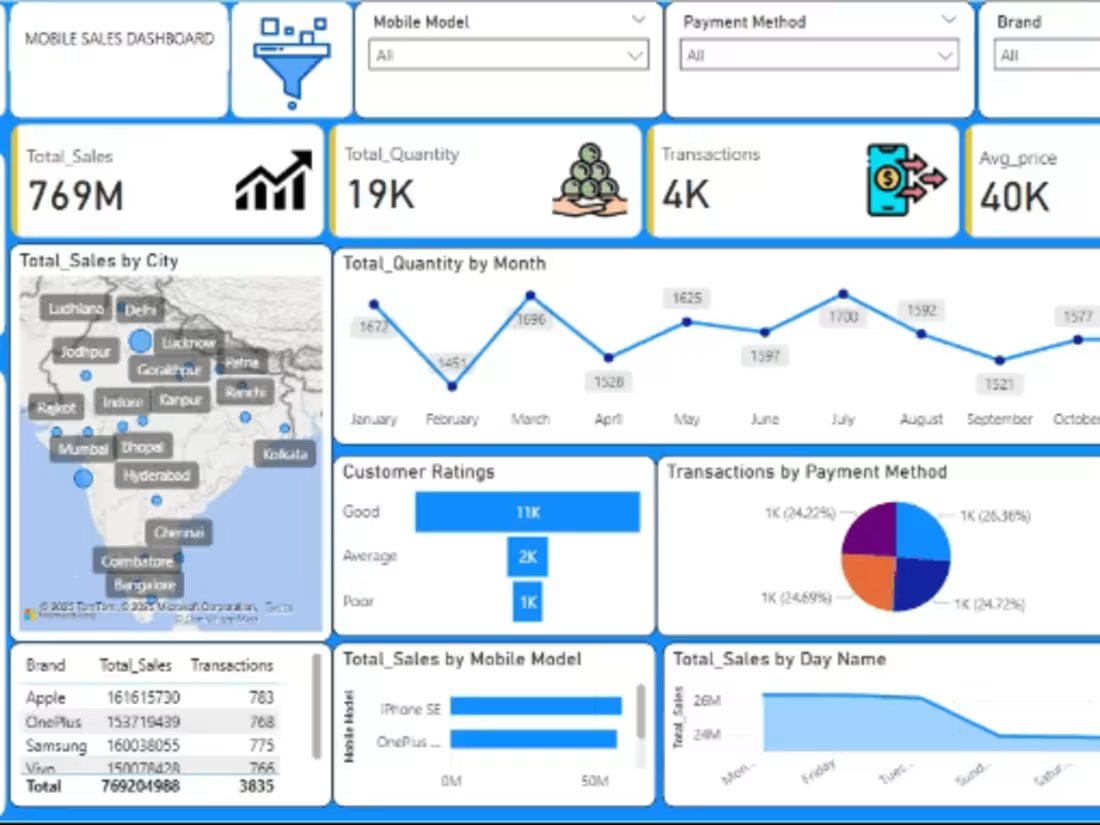
📊 Power BI Dashboard with Real-Time Data Refresh & Custom Filters
📈 Python Data Cleaning Script with CSV Export & Summary Report
📊 Monthly/Weekly Business Insights Dashboard (Power BI or Excel)
Rajendra's other services

Starting at$55
Duration4 days
Tags
Looker
Microsoft Excel
Microsoft Power BI
Python
SQL
Data Analyst
Data Modelling Analyst
Data Scientist
Service provided by
Rajendra Behera Mumbai, India
End-to-End Data Analysis with Reports & Dashboards in Power BI Rajendra Behera
Starting at$55
Duration4 days
Tags
Looker
Microsoft Excel
Microsoft Power BI
Python
SQL
Data Analyst
Data Modelling Analyst
Data Scientist
I offer expert data analysis services using Python, SQL, Power BI, and Excel to transform raw data into actionable insights. With a focus on creating interactive dashboards, automated reports, and visualizations, I help businesses make data-driven decisions. My unique strength lies in delivering clear, insightful, and customized solutions tailored to your business needs.
What's included
Cleaned & Structured Data with Actionable Insights (Excel, SQL, Python)
📊 Excel Dashboard with Pivot Tables, Charts & Reports
📈 SQL-Based Data Extraction & Filterable Report in Excel/CSV
📊 Power BI Dashboard with Real-Time Data Refresh & Custom Filters
📈 Python Data Cleaning Script with CSV Export & Summary Report
📊 Monthly/Weekly Business Insights Dashboard (Power BI or Excel)
Rajendra's other services
$55