
Power BI Dashboard Design & Data Visualization | BIwajid saleem
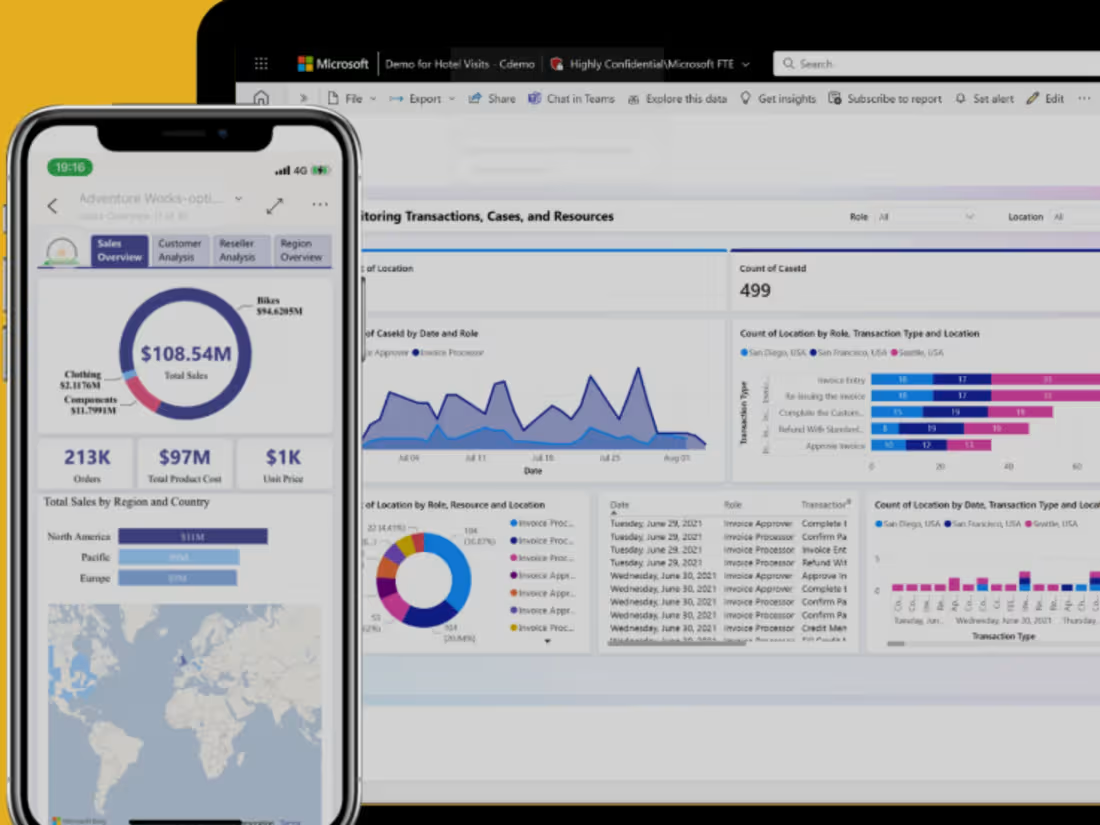
Turn your raw data into actionable insights with professional Power BI dashboards that make decision-making smarter and faster. I design interactive, visually engaging reports tailored to your business needs—whether it’s sales analysis, financial reporting, marketing dashboards, or executive KPI tracking.
With expertise in data modeling, DAX, and Power Query, I ensure your reports are accurate, automated, and business-ready. My Power BI solutions combine data visualization, storytelling, and business intelligence best practices to deliver insights that truly drive results.
👉 Let’s build a custom Power BI dashboard that empowers your team to make data-driven decisions with confidence.
What's included
Deliverables:
✅ Custom interactive Power BI dashboards for real-time insights
✅ Data modeling, cleaning & transformation for accurate reporting
✅ KPI & performance tracking with drill-through and filters
✅ Data integration from multiple sources (Excel, SQL, cloud apps, APIs)
✅ Automated business intelligence reports & scheduled refresh
✅ Documentation & support for smooth usage
FAQs
Just your data sources (Excel, SQL, Google Sheets, cloud apps, etc.) and the KPIs or metrics you want to track.
Yes! Power BI can connect to 100+ sources including databases, cloud services, and APIs.
Yes. I use Power Query to clean, transform, and prepare your data for accurate analysis.
Yes. I can set up scheduled refresh so your reports always show the latest data.
Yes. I provide documentation, a walkthrough, and guidance for your team.
Yes. I provide ongoing support and can build additional dashboards as your needs grow.
Depending on the complexity, most dashboards are delivered within 3–7 business days.
Starting at$15 /hr
Tags
Microsoft Power BI


Data Analyst
Data Scientist
Data Visualizer
Service provided by
wajid saleem Ahmedpur East, Pakistan
Power BI Dashboard Design & Data Visualization | BIwajid saleem
Starting at$15 /hr
Tags
Microsoft Power BI
Data Analyst
Data Scientist
Data Visualizer
Turn your raw data into actionable insights with professional Power BI dashboards that make decision-making smarter and faster. I design interactive, visually engaging reports tailored to your business needs—whether it’s sales analysis, financial reporting, marketing dashboards, or executive KPI tracking.
With expertise in data modeling, DAX, and Power Query, I ensure your reports are accurate, automated, and business-ready. My Power BI solutions combine data visualization, storytelling, and business intelligence best practices to deliver insights that truly drive results.
👉 Let’s build a custom Power BI dashboard that empowers your team to make data-driven decisions with confidence.
What's included
Deliverables:
✅ Custom interactive Power BI dashboards for real-time insights
✅ Data modeling, cleaning & transformation for accurate reporting
✅ KPI & performance tracking with drill-through and filters
✅ Data integration from multiple sources (Excel, SQL, cloud apps, APIs)
✅ Automated business intelligence reports & scheduled refresh
✅ Documentation & support for smooth usage
FAQs
Just your data sources (Excel, SQL, Google Sheets, cloud apps, etc.) and the KPIs or metrics you want to track.
Yes! Power BI can connect to 100+ sources including databases, cloud services, and APIs.
Yes. I use Power Query to clean, transform, and prepare your data for accurate analysis.
Yes. I can set up scheduled refresh so your reports always show the latest data.
Yes. I provide documentation, a walkthrough, and guidance for your team.
Yes. I provide ongoing support and can build additional dashboards as your needs grow.
Depending on the complexity, most dashboards are delivered within 3–7 business days.
$15 /hr