
Visualize Data: Unlock Business Potential with Expert InsightsPaul Muthee
I offer expert data visualization services that transform raw data into insightful, interactive dashboards and visual reports. What makes me unique is my blend of technical expertise and analytical acumen, ensuring that each visualization not only looks great but also delivers actionable insights to drive business success.
What's included
Interactive Dashboards
Custom-built dashboards that allow users to explore and interact with data.
Data Reports
Detailed reports summarizing key findings and insights.
Visualizations
Charts, graphs, and other visual elements that clearly present data trends and patterns.
Raw Data Files
Cleaned and formatted data files used for analysis.
Documentation
Comprehensive documentation explaining the data sources, methodology, and steps taken during the project.
Presentation
A polished presentation summarizing the project findings and recommendations.
Training Materials
Guides or tutorials to help users understand and use the visualizations effectively.
Implementation Support
Assistance with integrating the visualizations into the client’s existing systems.
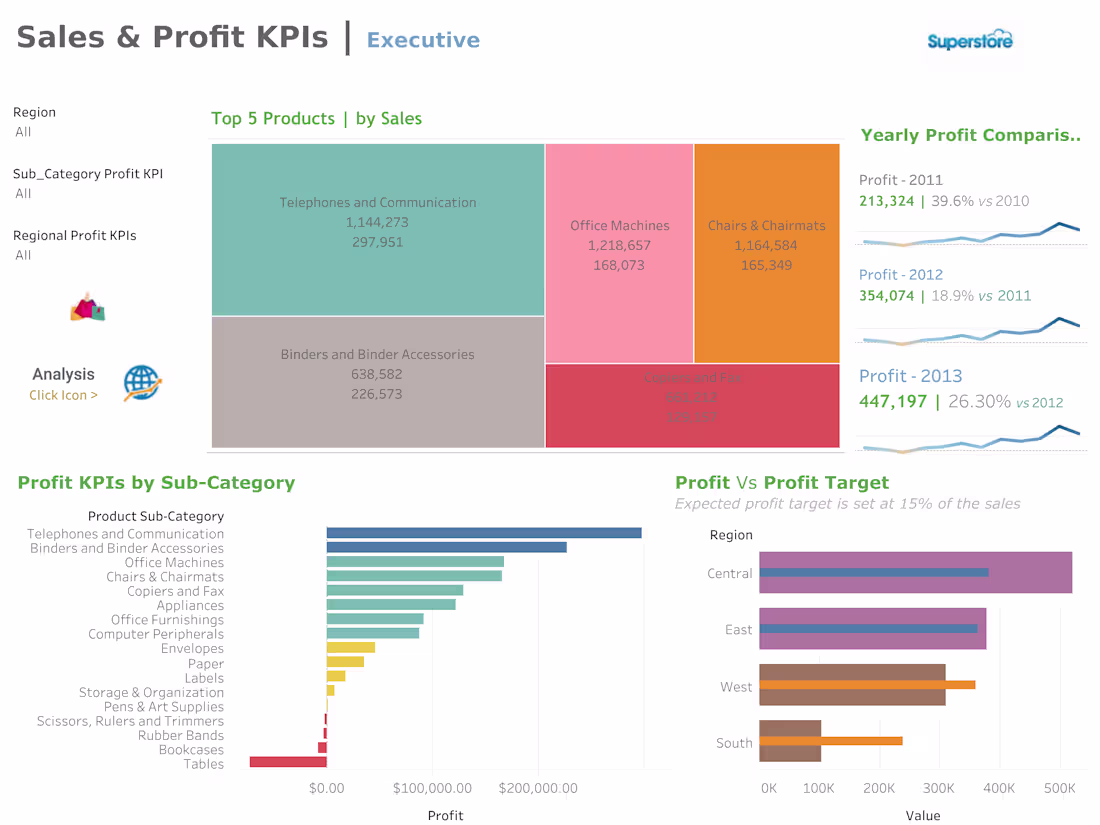
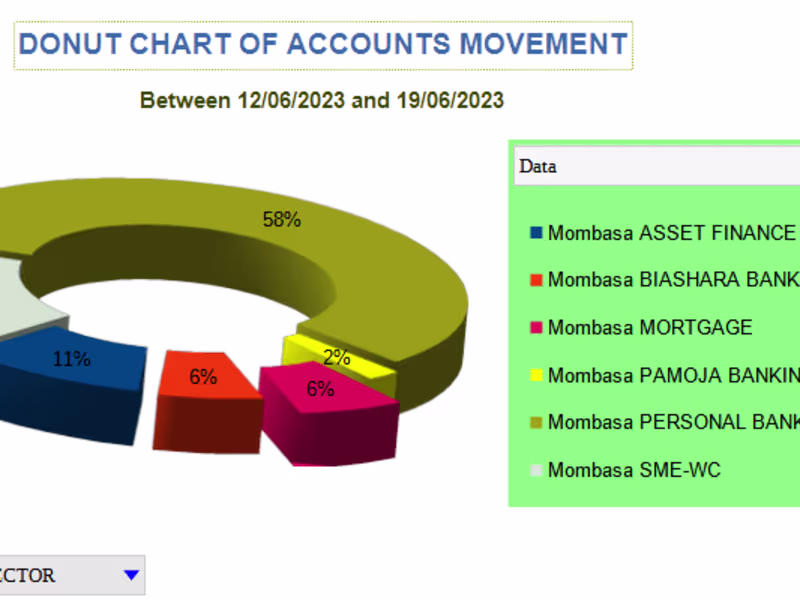
Example work

Paul's other services
Starting at$29 /hr
Tags
Google Sheets
Microsoft Excel
Microsoft Power BI
Python
Tableau
Data Analyst
Data Engineer
Data Entry Specialist
Service provided by
Paul Muthee Nairobi, Kenya
Visualize Data: Unlock Business Potential with Expert InsightsPaul Muthee
Starting at$29 /hr
Tags
Google Sheets
Microsoft Excel
Microsoft Power BI
Python
Tableau
Data Analyst
Data Engineer
Data Entry Specialist
I offer expert data visualization services that transform raw data into insightful, interactive dashboards and visual reports. What makes me unique is my blend of technical expertise and analytical acumen, ensuring that each visualization not only looks great but also delivers actionable insights to drive business success.
What's included
Interactive Dashboards
Custom-built dashboards that allow users to explore and interact with data.
Data Reports
Detailed reports summarizing key findings and insights.
Visualizations
Charts, graphs, and other visual elements that clearly present data trends and patterns.
Raw Data Files
Cleaned and formatted data files used for analysis.
Documentation
Comprehensive documentation explaining the data sources, methodology, and steps taken during the project.
Presentation
A polished presentation summarizing the project findings and recommendations.
Training Materials
Guides or tutorials to help users understand and use the visualizations effectively.
Implementation Support
Assistance with integrating the visualizations into the client’s existing systems.
Example work
Paul's other services
$29 /hr