
Interactive Python Dashboards with StreamlitAkash Singh
Stop wasting hours in Excel. Get a dashboard that answers your questions in 30 seconds.
I turn your messy business data into interactive dashboards that CEOs and teams actually love using.
What you get:
✅ Interactive Filters - Click team, date, or product to update all charts instantly
✅ Clean, Modern Design - No ugly Excel charts. Mobile-friendly layouts
✅ Live Data Connection - Connects to Google Sheets, CSV, or SQL databases
✅ One-Click Deployment - I host it online for you. No tech setup needed
✅ Source Code Included - You own everything. Edit it later if needed
Perfect for: Sales reports, KPI tracking, IPL/sports analytics, inventory, user behavior, financial dashboards
My Tech Stack: Python, Streamlit, Pandas, Plotly
Why me:
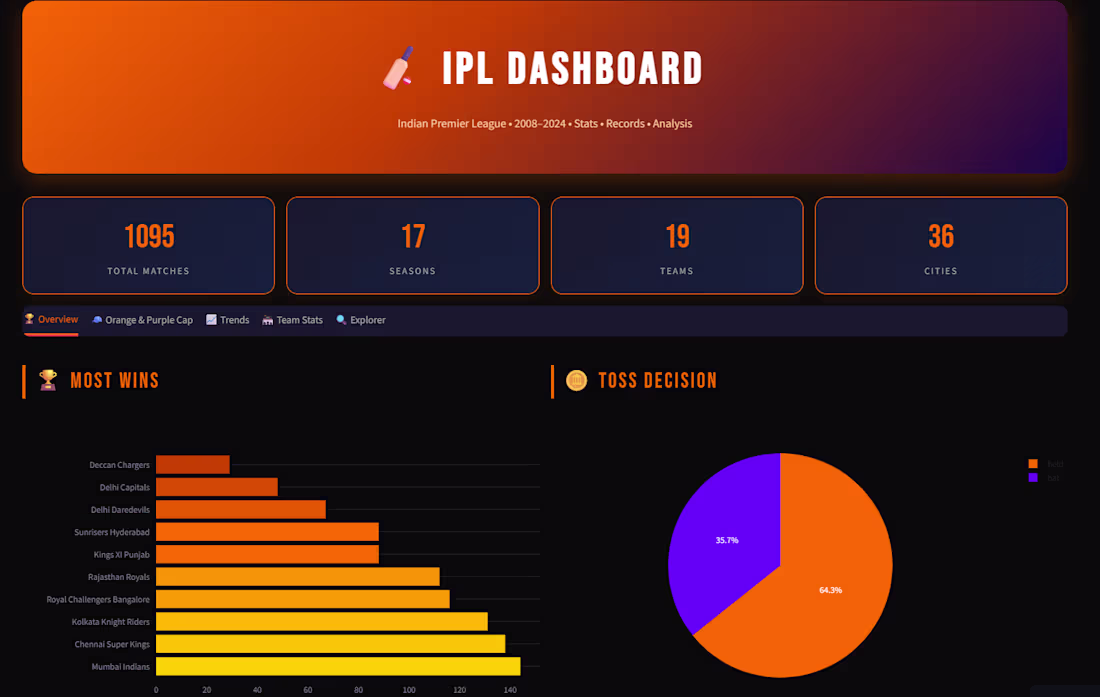
I recently built an IPL Dashboard analyzing 1095 matches across 17 seasons. I understand how to turn raw data into stories that drive decisions.
Delivery: 4-7 days for standard dashboards
Revisions: Unlimited until you're happy
Ready to see your data clearly? Message me with your Excel file.
FAQs
Akash's other services
Starting at$150
Duration1 week
Tags
pandas
Python
Streamlit
Business Intelligence
Dashboard
Data Analyst
Data visualization
Service provided by
Akash Singh Delhi, India
- 1
- Followers
Interactive Python Dashboards with StreamlitAkash Singh
Starting at$150
Duration1 week
Tags
pandas
Python
Streamlit
Business Intelligence
Dashboard
Data Analyst
Data visualization
Stop wasting hours in Excel. Get a dashboard that answers your questions in 30 seconds.
I turn your messy business data into interactive dashboards that CEOs and teams actually love using.
What you get:
✅ Interactive Filters - Click team, date, or product to update all charts instantly
✅ Clean, Modern Design - No ugly Excel charts. Mobile-friendly layouts
✅ Live Data Connection - Connects to Google Sheets, CSV, or SQL databases
✅ One-Click Deployment - I host it online for you. No tech setup needed
✅ Source Code Included - You own everything. Edit it later if needed
Perfect for: Sales reports, KPI tracking, IPL/sports analytics, inventory, user behavior, financial dashboards
My Tech Stack: Python, Streamlit, Pandas, Plotly
Why me:
I recently built an IPL Dashboard analyzing 1095 matches across 17 seasons. I understand how to turn raw data into stories that drive decisions.
Delivery: 4-7 days for standard dashboards
Revisions: Unlimited until you're happy
Ready to see your data clearly? Message me with your Excel file.
FAQs
Akash's other services
$150