
Power BI Reports & Dashboards for Business InsightsMuneeb Shafique
👋 Greetings!
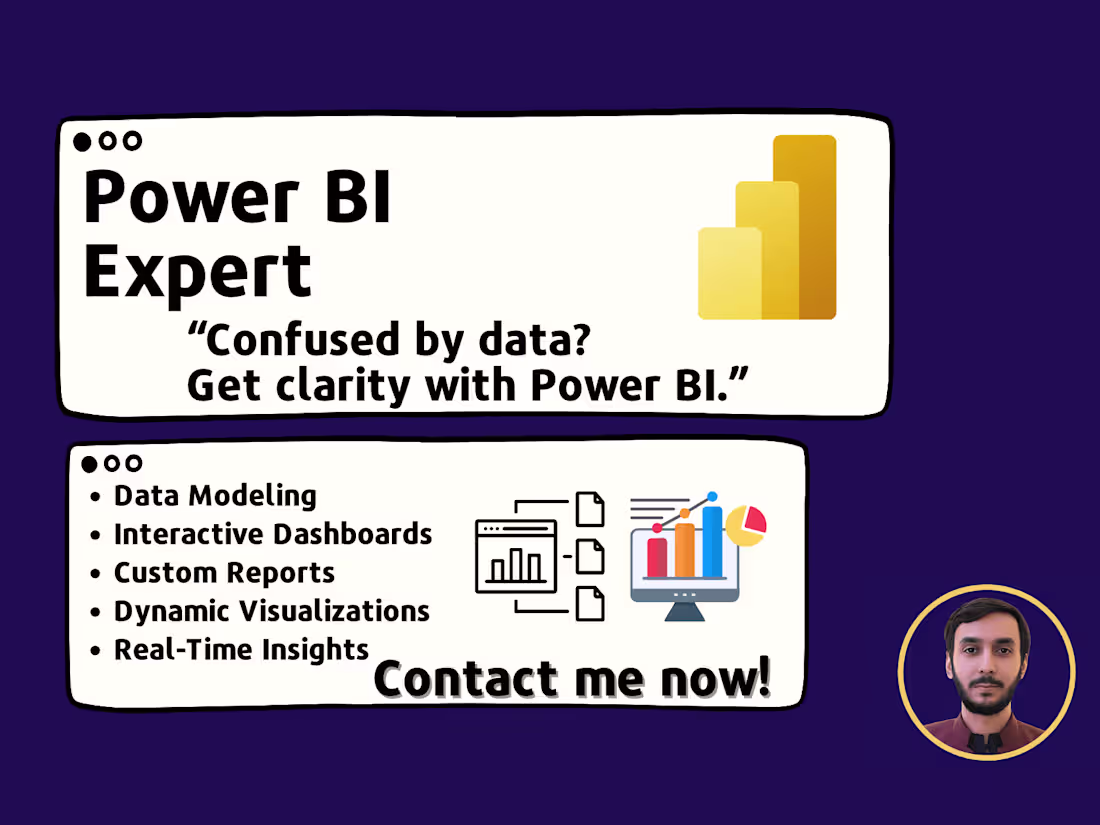
Are you drowning in scattered data and confusing reports? With Power BI, I can turn your raw numbers into clarity and confidence.
Build smart data models for solid insights
Create interactive dashboards you’ll actually use
Design custom reports tailored to your goals
Transform messy data into clean, structured views
Deliver real-time insights that drive decisions
Let’s make your data work smarter, not harder! 🚀
What's included
Data Modeling
Structuring raw data into meaningful tables and relationships for accurate and efficient analysis.
Interactive Dashboards
User-friendly dashboards with filters, slicers, and drill-down features to explore data in real time.
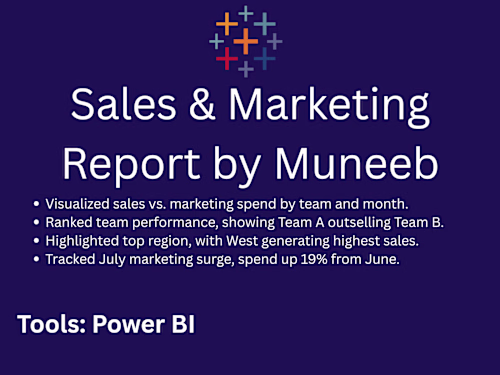
Custom Reports
Tailored reports with relevant KPIs, charts, and metrics aligned with your specific business goals.
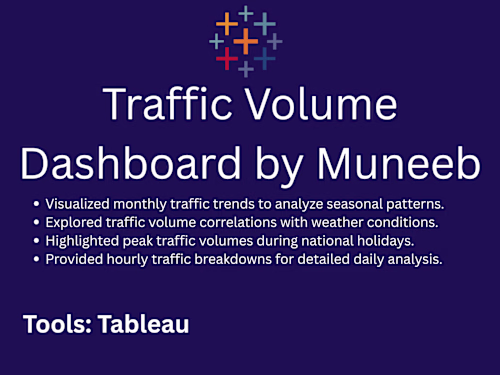
Dynamic Visualizations
Engaging visuals like bar charts, pie charts, line graphs, and maps that update with your data.
Real-Time Insights
Automated data refresh and live connections to give you up-to-date business intelligence instantly.
FAQs

Contact for pricing
Tags
Microsoft Power BI
Tableau
Data Analyst
Data Scientist
Data Visualizer
Service provided by
Muneeb Shafique Faisalabad, Pakistan
- 5
- Followers
Power BI Reports & Dashboards for Business InsightsMuneeb Shafique
Contact for pricing
Tags
Microsoft Power BI
Tableau
Data Analyst
Data Scientist
Data Visualizer
👋 Greetings!
Are you drowning in scattered data and confusing reports? With Power BI, I can turn your raw numbers into clarity and confidence.
Build smart data models for solid insights
Create interactive dashboards you’ll actually use
Design custom reports tailored to your goals
Transform messy data into clean, structured views
Deliver real-time insights that drive decisions
Let’s make your data work smarter, not harder! 🚀
What's included
Data Modeling
Structuring raw data into meaningful tables and relationships for accurate and efficient analysis.
Interactive Dashboards
User-friendly dashboards with filters, slicers, and drill-down features to explore data in real time.
Custom Reports
Tailored reports with relevant KPIs, charts, and metrics aligned with your specific business goals.
Dynamic Visualizations
Engaging visuals like bar charts, pie charts, line graphs, and maps that update with your data.
Real-Time Insights
Automated data refresh and live connections to give you up-to-date business intelligence instantly.
FAQs
Contact for pricing