
"Insightful Data Visualization with Excel, Tableau, & Power BI"Juliette Edna
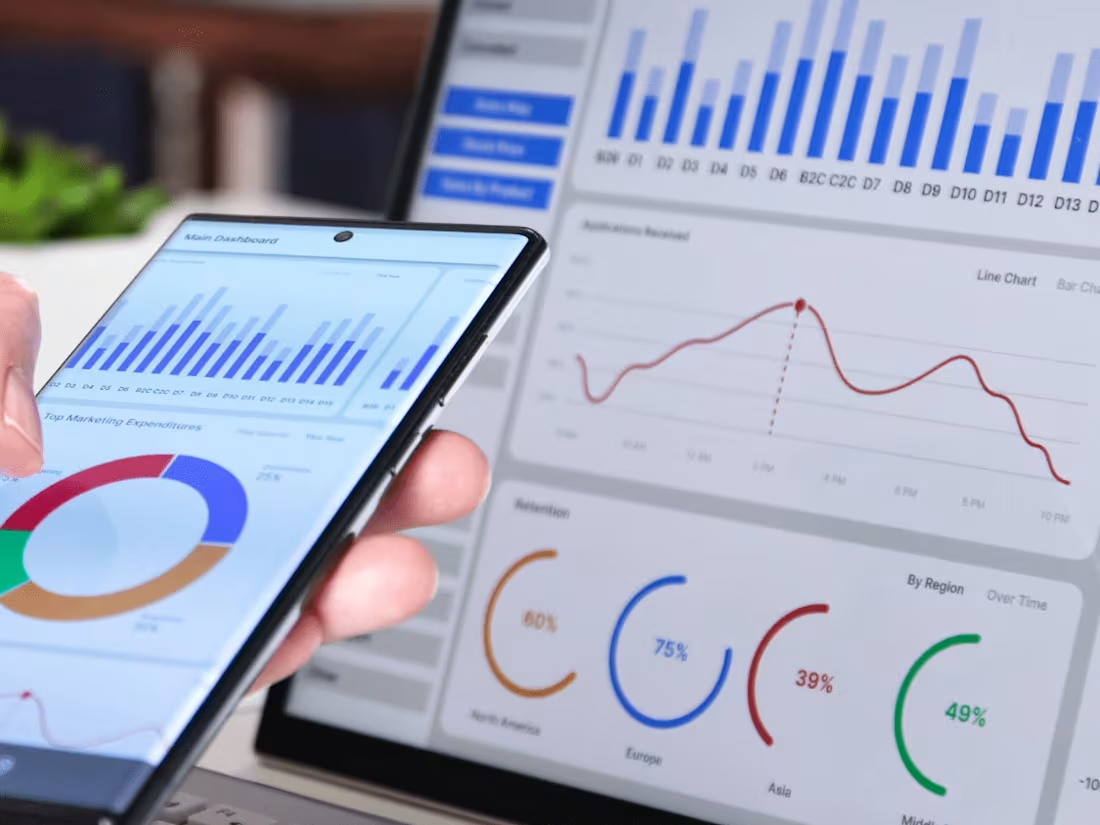
I offer custom data visualization solutions using Excel, Python, and Power BI to transform raw data into actionable insights through interactive dashboards and clear, insightful reports. What sets me apart is my ability to not only create visually compelling visuals but also ensure they are tailored to meet your specific business needs, making complex data easily understandable.
What's included
Comprehensive Data Visualization & Analysis Deliverables"
Interactive Dashboards – Built in Excel, Power BI, or Python for real-time insights.
Custom Data Visuals – Charts, graphs, and infographics tailored to the client’s data.
Data Analysis Report – A comprehensive report summarizing key findings and insights.
Source Files – Excel spreadsheets, Power BI reports, or Python scripts for future use.
Data Presentation – A slide deck or visual summary for easy communication of results.
Training/Documentation – Guidelines or training sessions for using the delivered dashboards.
Juliette's other services


Starting at$100
Duration1 week
Tags
D3.js
Matplotlib
Tableau
TensorFlow
three.js
Data Analyst
Data Scientist
Data Visualizer
Service provided by
Juliette Edna Mombasa, Kenya
"Insightful Data Visualization with Excel, Tableau, & Power BI"Juliette Edna
Starting at$100
Duration1 week
Tags
D3.js
Matplotlib
Tableau
TensorFlow
three.js
Data Analyst
Data Scientist
Data Visualizer
I offer custom data visualization solutions using Excel, Python, and Power BI to transform raw data into actionable insights through interactive dashboards and clear, insightful reports. What sets me apart is my ability to not only create visually compelling visuals but also ensure they are tailored to meet your specific business needs, making complex data easily understandable.
What's included
Comprehensive Data Visualization & Analysis Deliverables"
Interactive Dashboards – Built in Excel, Power BI, or Python for real-time insights.
Custom Data Visuals – Charts, graphs, and infographics tailored to the client’s data.
Data Analysis Report – A comprehensive report summarizing key findings and insights.
Source Files – Excel spreadsheets, Power BI reports, or Python scripts for future use.
Data Presentation – A slide deck or visual summary for easy communication of results.
Training/Documentation – Guidelines or training sessions for using the delivered dashboards.
Juliette's other services
$100