
Data Analysis and Visualization with PythonPromise Esemuede
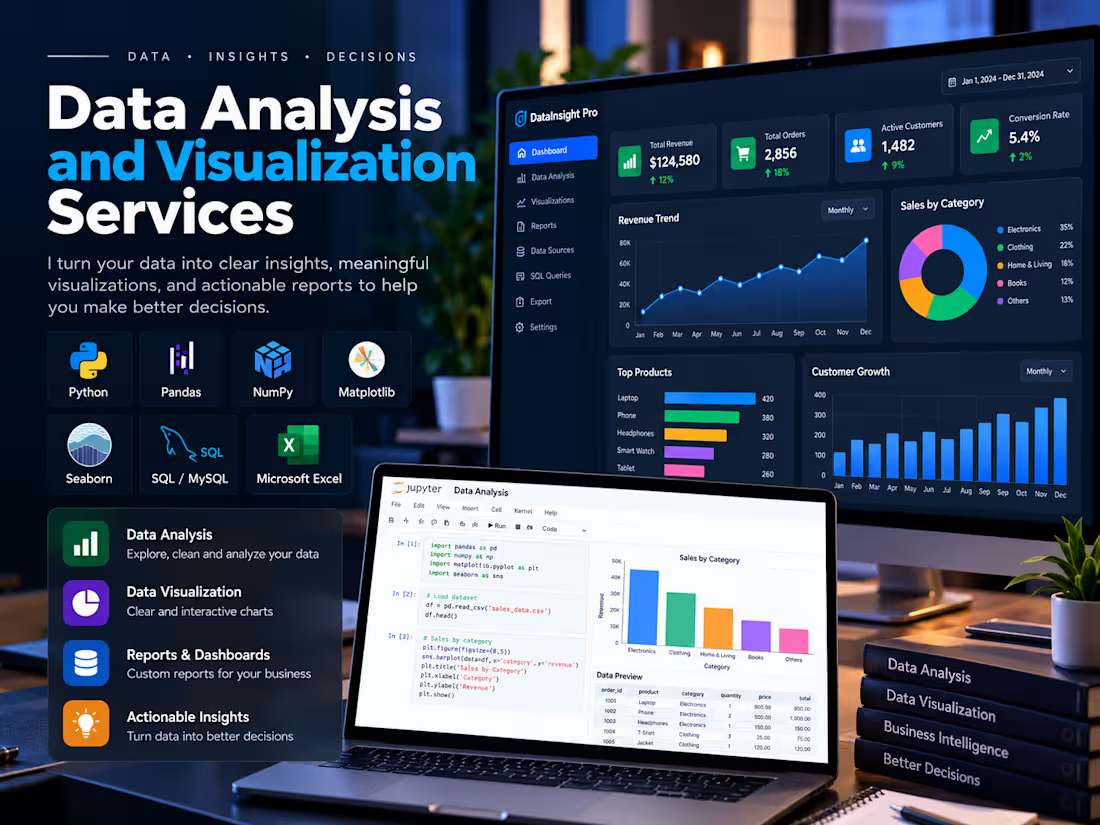
I help businesses and individuals turn raw data into meaningful insights through data analysis, visualization, and reporting.
Using Python and other data analysis tools, I clean, process, explore, and analyze datasets to uncover trends, identify patterns, measure performance, and support better business decisions.
Whether you have sales records, customer information, financial data, business records, or other datasets, I can help transform your data into clear and useful information.
What I can do for you
Data cleaning and preprocessing
Exploratory data analysis (EDA)
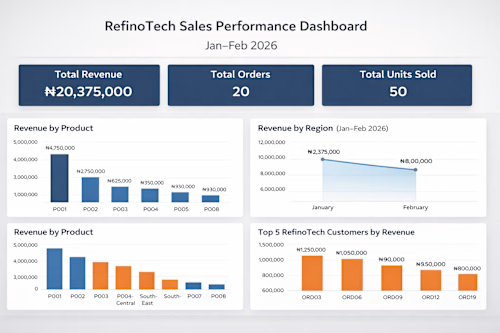
Sales and revenue analysis
Customer and product performance analysis
Business performance analysis
Data transformation and manipulation
SQL queries and database analysis
Statistical summaries and descriptive analysis
Data visualization using charts and graphs
Excel reports and data summaries
Custom analytical dashboards
Trend identification and performance reporting
Tools and technologies
Python
Pandas
NumPy
Matplotlib
Seaborn
SQL and MySQL
Microsoft Excel
My approach
Understand your business objectives and the questions you want your data to answer.
Inspect, clean, and prepare your dataset.
Perform the required analysis and identify meaningful patterns.
Create visualizations, charts, and reports.
Present the findings in a clear and understandable format.
What you can receive
Depending on the project requirements, deliverables may include:
Cleaned and organized datasets.
Python analysis scripts or notebooks.
Charts and visualizations.
Excel reports and summaries.
Key findings and actionable business insights.
Data analysis documentation.
What I need to get started
Your dataset (CSV, Excel, or SQL/MySQL).
A brief explanation of what you want to achieve.
Specific questions you want the analysis to answer.
Any preferred reporting format or reference examples.
I approach every project based on its actual requirements, ensuring the analysis is relevant to your objectives.
Need help understanding your data? Send me a message, and let's get started.
FAQs

Contact for pricing
Duration1 week
Tags
Matplotlib
Microsoft Excel

pandas

Python

seaborn

SQL
Data Analyst
Data Visualizer
NumPy
Service provided by
Promise Esemuede Lagos, Nigeria
- 8
- Followers
Data Analysis and Visualization with PythonPromise Esemuede
Contact for pricing
Duration1 week
Tags
Matplotlib
Microsoft Excel
pandas
Python
seaborn
SQL
Data Analyst
Data Visualizer
NumPy
I help businesses and individuals turn raw data into meaningful insights through data analysis, visualization, and reporting.
Using Python and other data analysis tools, I clean, process, explore, and analyze datasets to uncover trends, identify patterns, measure performance, and support better business decisions.
Whether you have sales records, customer information, financial data, business records, or other datasets, I can help transform your data into clear and useful information.
What I can do for you
Data cleaning and preprocessing
Exploratory data analysis (EDA)
Sales and revenue analysis
Customer and product performance analysis
Business performance analysis
Data transformation and manipulation
SQL queries and database analysis
Statistical summaries and descriptive analysis
Data visualization using charts and graphs
Excel reports and data summaries
Custom analytical dashboards
Trend identification and performance reporting
Tools and technologies
Python
Pandas
NumPy
Matplotlib
Seaborn
SQL and MySQL
Microsoft Excel
My approach
Understand your business objectives and the questions you want your data to answer.
Inspect, clean, and prepare your dataset.
Perform the required analysis and identify meaningful patterns.
Create visualizations, charts, and reports.
Present the findings in a clear and understandable format.
What you can receive
Depending on the project requirements, deliverables may include:
Cleaned and organized datasets.
Python analysis scripts or notebooks.
Charts and visualizations.
Excel reports and summaries.
Key findings and actionable business insights.
Data analysis documentation.
What I need to get started
Your dataset (CSV, Excel, or SQL/MySQL).
A brief explanation of what you want to achieve.
Specific questions you want the analysis to answer.
Any preferred reporting format or reference examples.
I approach every project based on its actual requirements, ensuring the analysis is relevant to your objectives.
Need help understanding your data? Send me a message, and let's get started.
FAQs
Contact for pricing