
Transforming data into meaningful insights with Power BIEdwin Kithinji
Using Power BI I will clean, transform, and create dashboard and visualization to provide actionable insights. The dashboard and visualization component presents key metrics through interactive charts, graphs, and real-time updates, enabling your businesses to track performance effectively. The process will ensure data integrity, improve decision-making, and enhance reporting efficiency. With automated data refresh and intuitive design, Power BI will empower your business to analyze trends, monitor KPIs, and derive meaningful insights for strategic growth and operational excellence.
What's included
Data Cleaning and Transformation
Ensuring high-quality, structured, and reliable data for analysis.
This includes removing duplicates, handling missing values, standardizing formats, and correcting inconsistencies.
Using Power Query, raw data is transformed through filtering, merging, and advanced calculations to enhance usability.
The process will include automated data refresh, normalization, and integration from multiple sources for seamless reporting.
Clean, well-structured data improves accuracy, supports better visualization, and enhances decision-making.
By streamlining data preparation, your businesses can focus on insights rather than data issues, ensuring efficient reporting and analytics in Power BI.
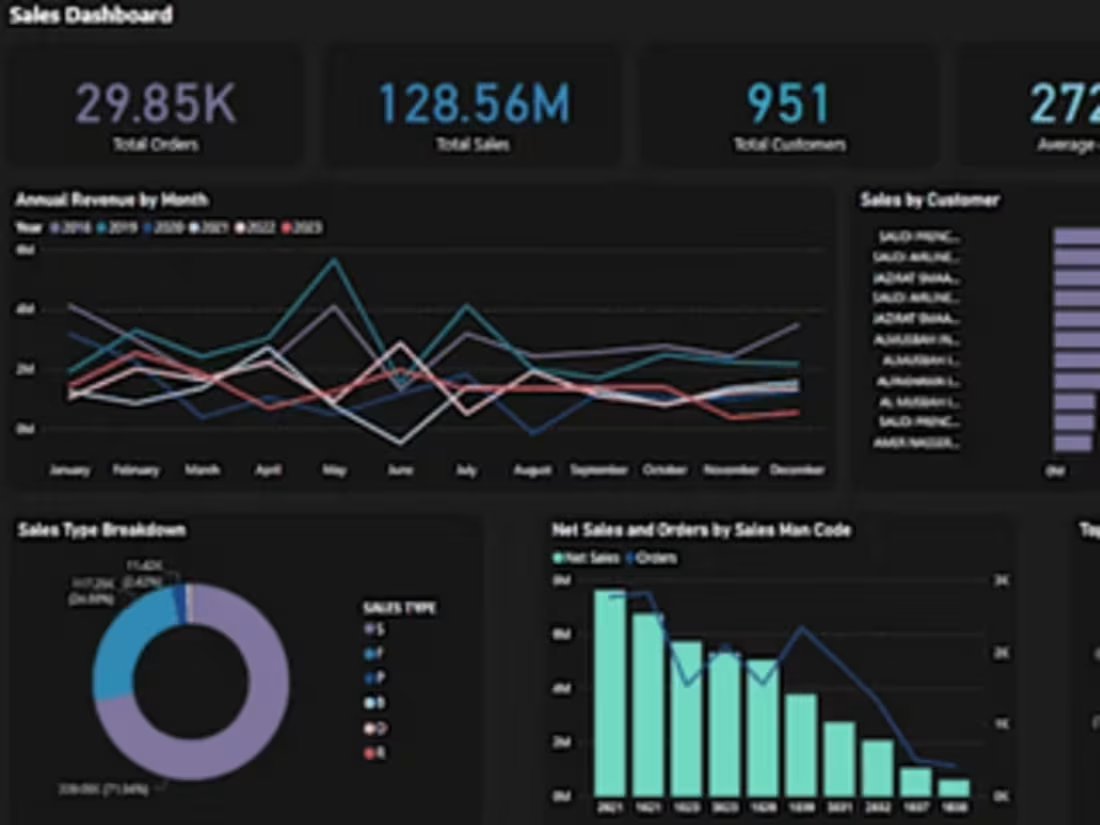
Dashboard and Visualization
Provides interactive, data-driven insights to support informed decision-making.
This includes developing customized dashboards with dynamic charts, graphs, and KPIs tailored to specific business needs.
Enhances data storytelling through visually compelling reports, drill-down capabilities, and real-time updates.
Key features may include trend analysis, performance tracking, and automated data refresh for accuracy.
Designed for ease of use, the dashboard will allow you to explore data intuitively.
Whether for sales, finance, operations, or marketing, a well-crafted Power BI visualization will enable you to identify patterns, monitor metrics, and drive strategic decisions effectively.
Edwin 's other services


Contact for pricing
Tags
Microsoft Excel
Microsoft Power BI
Microsoft PowerPoint
Business Analyst
Data Analyst
Data Visualizer
Service provided by
Edwin Kithinji Nairobi, Kenya
- 1
- Followers
Transforming data into meaningful insights with Power BIEdwin Kithinji
Contact for pricing
Tags
Microsoft Excel
Microsoft Power BI
Microsoft PowerPoint
Business Analyst
Data Analyst
Data Visualizer
Using Power BI I will clean, transform, and create dashboard and visualization to provide actionable insights. The dashboard and visualization component presents key metrics through interactive charts, graphs, and real-time updates, enabling your businesses to track performance effectively. The process will ensure data integrity, improve decision-making, and enhance reporting efficiency. With automated data refresh and intuitive design, Power BI will empower your business to analyze trends, monitor KPIs, and derive meaningful insights for strategic growth and operational excellence.
What's included
Data Cleaning and Transformation
Ensuring high-quality, structured, and reliable data for analysis.
This includes removing duplicates, handling missing values, standardizing formats, and correcting inconsistencies.
Using Power Query, raw data is transformed through filtering, merging, and advanced calculations to enhance usability.
The process will include automated data refresh, normalization, and integration from multiple sources for seamless reporting.
Clean, well-structured data improves accuracy, supports better visualization, and enhances decision-making.
By streamlining data preparation, your businesses can focus on insights rather than data issues, ensuring efficient reporting and analytics in Power BI.
Dashboard and Visualization
Provides interactive, data-driven insights to support informed decision-making.
This includes developing customized dashboards with dynamic charts, graphs, and KPIs tailored to specific business needs.
Enhances data storytelling through visually compelling reports, drill-down capabilities, and real-time updates.
Key features may include trend analysis, performance tracking, and automated data refresh for accuracy.
Designed for ease of use, the dashboard will allow you to explore data intuitively.
Whether for sales, finance, operations, or marketing, a well-crafted Power BI visualization will enable you to identify patterns, monitor metrics, and drive strategic decisions effectively.
Edwin 's other services
Contact for pricing