
Data Visualizations for Reports, Newsrooms & Policy ProjectsMayank Munjal
I create custom, interactive data visualizations that turn complex information into clear, engaging digital stories. With a background in journalism and policy, I specialize in building visuals that not only look great but also communicate impact.
What's included
Data Visualizations for Reports, Newsrooms & Policy Projects
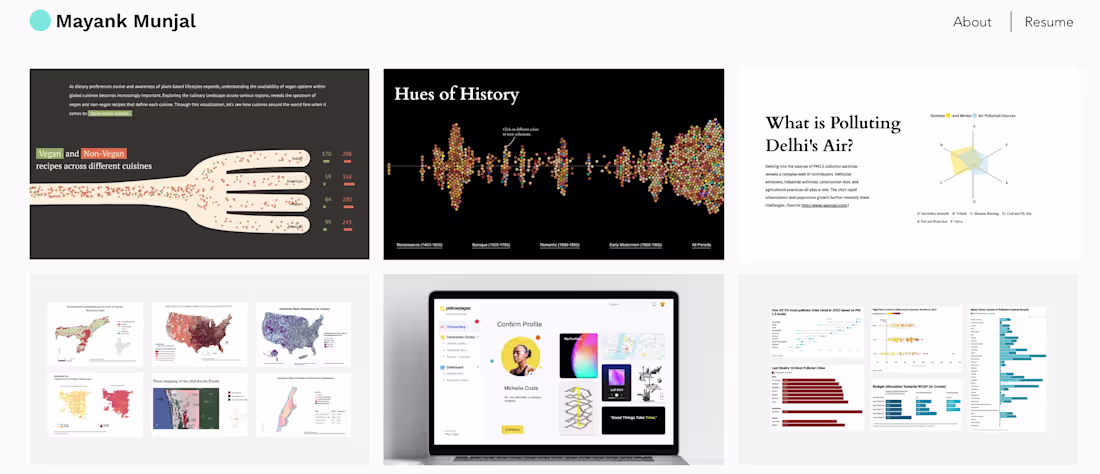
I design and develop custom data visualizations that transform complex datasets into clear, compelling, and interactive stories.
Whether you're a newsroom, policy institute, or climate/energy organization, I can help communicate your data through scrollytelling visuals, web dashboards, or interactive explainers; built using modern tools like D3.js, Svelte or highly customized designs using Figma.
What I Offer:
- Static custom charts for print/reports
- Interactive charts (bump charts, slope graphs, radial diagrams, etc.)
- Scrollytelling experiences with smooth transitions
- Custom data dashboards with filters, tooltips, and interactivity
- Visualizations embedded into reports or websites
- Story-driven visual explainers for articles or campaigns
Starting at$25 /hr
Tags
D3.js
Matplotlib
Tableau
TensorFlow
three.js
Data Analyst
Data Scientist
Data Visualizer
Service provided by
Mayank Munjal Gurugram, India
Data Visualizations for Reports, Newsrooms & Policy ProjectsMayank Munjal
Starting at$25 /hr
Tags
D3.js
Matplotlib
Tableau
TensorFlow
three.js
Data Analyst
Data Scientist
Data Visualizer
I create custom, interactive data visualizations that turn complex information into clear, engaging digital stories. With a background in journalism and policy, I specialize in building visuals that not only look great but also communicate impact.
What's included
Data Visualizations for Reports, Newsrooms & Policy Projects
I design and develop custom data visualizations that transform complex datasets into clear, compelling, and interactive stories.
Whether you're a newsroom, policy institute, or climate/energy organization, I can help communicate your data through scrollytelling visuals, web dashboards, or interactive explainers; built using modern tools like D3.js, Svelte or highly customized designs using Figma.
What I Offer:
- Static custom charts for print/reports
- Interactive charts (bump charts, slope graphs, radial diagrams, etc.)
- Scrollytelling experiences with smooth transitions
- Custom data dashboards with filters, tooltips, and interactivity
- Visualizations embedded into reports or websites
- Story-driven visual explainers for articles or campaigns
$25 /hr