
Data Visualization and Presenting InsightsSiraj Hasan
I offer comprehensive services in data visualization and report creation, including interactive dashboards, detailed charts and graphs, infographics, and trend analysis visuals. My deliverables also include insight reports with actionable recommendations, executive summaries, and visually engaging presentations. Each visualization and report is customized to meet the specific needs of the project, ensuring clear communication of key insights.
What's included
Dashboards, Graphs etc.
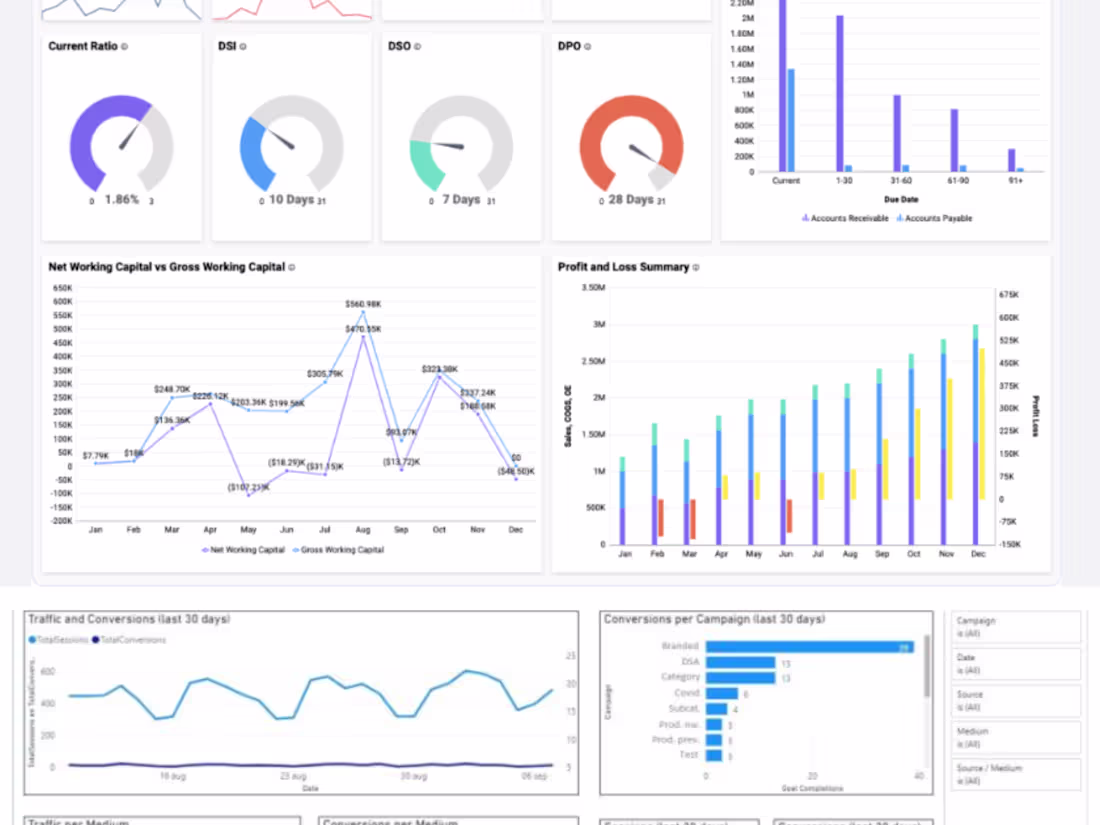
- Interactive dashboards (Power BI, Tableau, Excel)
- Charts and graphs (bar charts, line graphs, pie charts, etc.)
- Infographics for key data points
- Insight reports with detailed findings and recommendations
- Executive summaries for stakeholders
- Presentations (PowerPoint, PDF) with visual storytelling
- Trend analysis visuals (historical and forecasting)
- Custom visualizations tailored to project needs
- Annotations and key takeaways within visuals
Siraj's other services
Starting at$250
Duration1 week
Tags
Python
R
RStudio
Data Analyst
Data Visualizer
Statistician
Service provided by
Siraj Hasan Lahore, Pakistan
- 1
- Followers
Data Visualization and Presenting InsightsSiraj Hasan
Starting at$250
Duration1 week
Tags
Python
R
RStudio
Data Analyst
Data Visualizer
Statistician
I offer comprehensive services in data visualization and report creation, including interactive dashboards, detailed charts and graphs, infographics, and trend analysis visuals. My deliverables also include insight reports with actionable recommendations, executive summaries, and visually engaging presentations. Each visualization and report is customized to meet the specific needs of the project, ensuring clear communication of key insights.
What's included
Dashboards, Graphs etc.
- Interactive dashboards (Power BI, Tableau, Excel)
- Charts and graphs (bar charts, line graphs, pie charts, etc.)
- Infographics for key data points
- Insight reports with detailed findings and recommendations
- Executive summaries for stakeholders
- Presentations (PowerPoint, PDF) with visual storytelling
- Trend analysis visuals (historical and forecasting)
- Custom visualizations tailored to project needs
- Annotations and key takeaways within visuals
Siraj's other services
$250