Freelance Data Visualizers in Dhaka
Sign Up
Post a job
Sign Up
Log In
Filters
2
Projects
People
Orbix Studio
max
Dhaka, Bangladesh
UX-led product design & dev agency for b2b saas and AI
$25k+
Earned
1x
Hired
200
Followers
expert
Follow
Message
UX-led product design & dev agency for b2b saas and AI
0
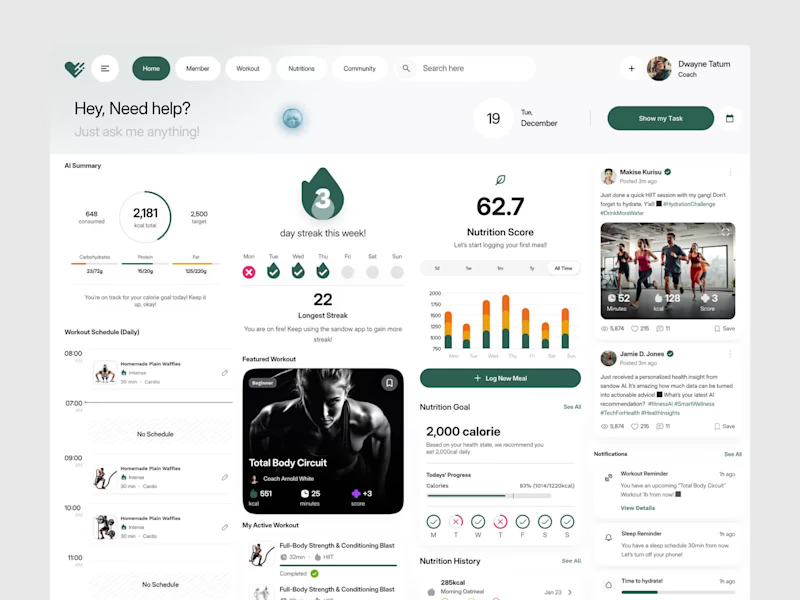
The best fitness tool isn't the one with the most features. It's the one athletes actually open every single morning. That was the design principle behind this AI-powered fitness dashboard built around the idea that tracking calories, workouts, nutrition, and streaks should feel motivating, not overwhelming. Most fitness dashboards collect data and nothing else. Athletes, coaches, and health-conscious people deserve better than a generic interface that feels like a spreadsheet with a logo. This dashboard built the experience to match the motivation. Deep forest green and clean white canvas. An AI assistant is ready the moment you open it. Calorie progress, streak tracking, nutrition score, featured workouts, daily schedule, and community feed: every section working together as one unified fitness ecosystem. Workout reminders, sleep reminders, and hydration alerts are all visible without opening a single sub-menu. Because showing up deserves a tool that makes it feel worth it before the first rep. What's the one feature most fitness apps completely overlook for real daily use? 👇
0
401
0
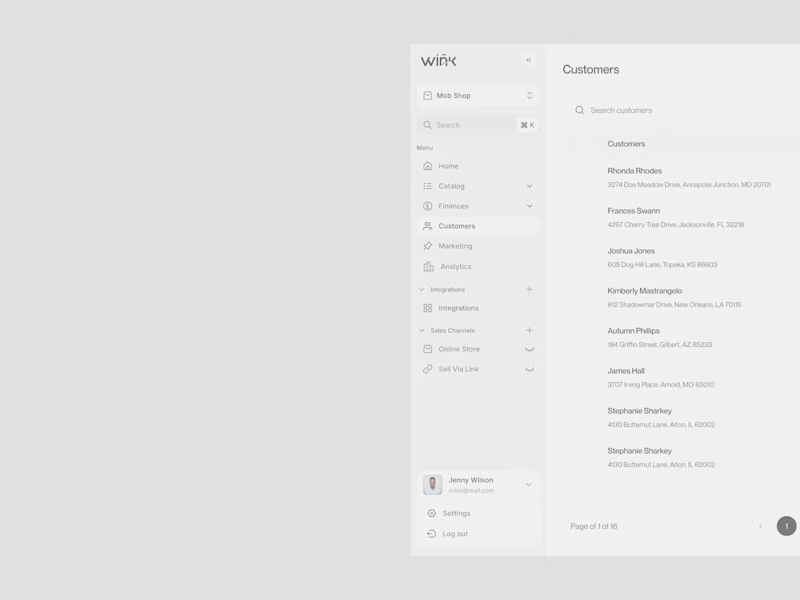
A fashion brand lives and dies by its details. The backend should be no different. That was the design principle behind the Wink customer management dashboard, a backend experience built with the same monochrome precision as the brand it serves. Most e-commerce operation tools are designed for utility and nothing else. The team managing real customers, real orders, and real revenue every day deserves better than a generic interface that contradicts everything the brand stands for on the outside. Wink built the inside to match the outside. Clean white canvas. Sharp black typography. A sidebar organizing Catalog, Finances, Customers, Marketing, Analytics, and Sales Channels every section exactly where an operations team needs it, nothing they don't. The customer table says everything: name, location, order count, and total spent. No unnecessary charts. No dashboard bloat. Just precise, scannable data presented the way a premium fashion brand presents everything it touches. Because operations teams deserve a tool that respects the brand as much as the customer does. What's the one thing most e-commerce dashboards get completely wrong for fashion brands? 👇
0
398
0
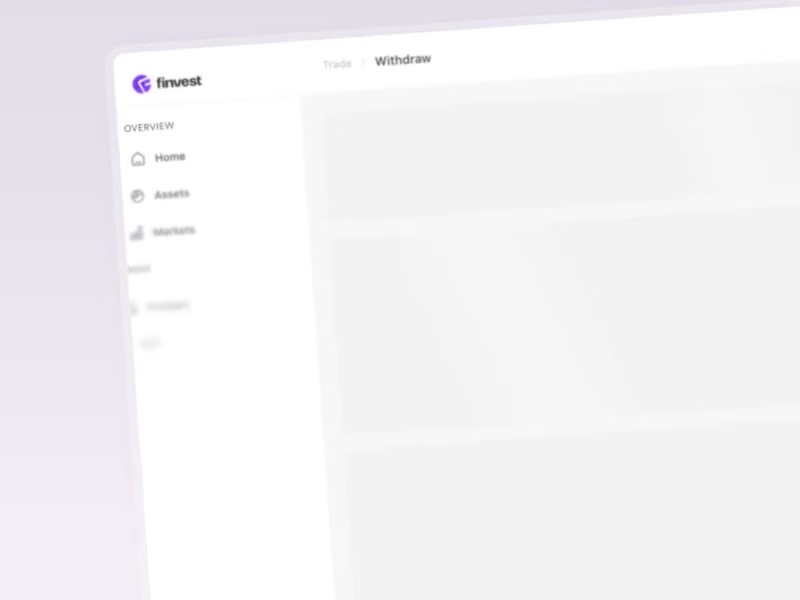
What if managing crypto portfolios felt as clean as the interface you're looking at right now? That was the core question behind Finvest, a crypto investment dashboard designed for traders who need BTC, ETH, Dogecoin, and US dollar positions visible, manageable, and actionable from a single screen. Most crypto dashboards are either overwhelmed with charts or undersell the data that actually drives decisions. The result is a tool traders tolerate rather than trust. Current balance is visible the moment you open it. Investment portfolios for BTC, ETH, and trending coins with total shares and return rates side by side. Transaction history in progress, Complete across Bitcoin, Dogecoin, Ethereum, US Dollar, and USD Coin all in one scannable table. Fast crypto withdrawals. This week is trending with Dogecoin, Bitcoin, and Ethereum price movements. All inside a clean white dashboard that makes $5,723 feel completely in control. The lavender-purple brand backdrop, crisp white dashboard canvas, and coin-color iconography do something most fintech tools never attempt: they make a complex multi-asset portfolio feel genuinely manageable. What's the one dashboard feature most crypto platforms get completely wrong?
0
381
0
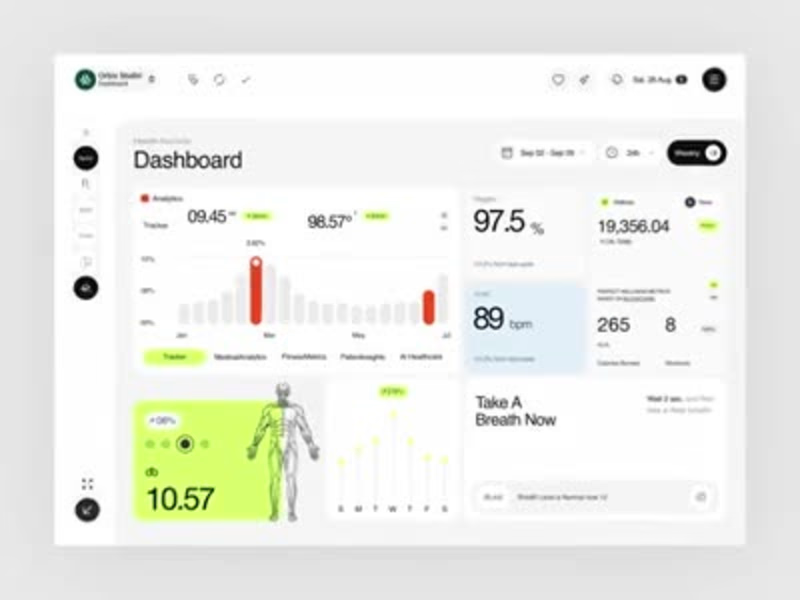
Most health dashboards show you numbers. This one tells you what to do with them right down to "Take A Breath Now." A modern health records dashboard designed to make medical analytics, fitness metrics, and wellness insights feel clear and genuinely personal. Built for clinicians, coaches, and individuals managing their complete health picture in one workspace. Designed in Figma with a clean white and neon green interface that keeps complex health data easy to act on. Tracker analytics, oxygen levels, heart rate, calories, workouts, breath coaching, and blockchain-verified wellness metrics all in one calm, readable layout. The same structure adapts easily for medical SaaS, personal wellness apps, fitness tracking, or AI healthcare products. Every section designed to balance clinical precision with human warmth. Really happy with how the crisp white canvas, neon green accents, and human anatomy visuals turned complex medical data into something that actually feels good to open every morning. Would love to hear your thoughts on the UI direction. 👀 UX Design | Health Tech | Dashboard UI | SaaS Platform Tools: Figma, Jitter
0
438
Data Visualizer
(9)
Follow
Message
Tauhid Hasan
Dhaka, Bangladesh
UI/UX Designer | Framer and Wix Studio Expert
29
Followers
Follow
Message
UI/UX Designer | Framer and Wix Studio Expert
0
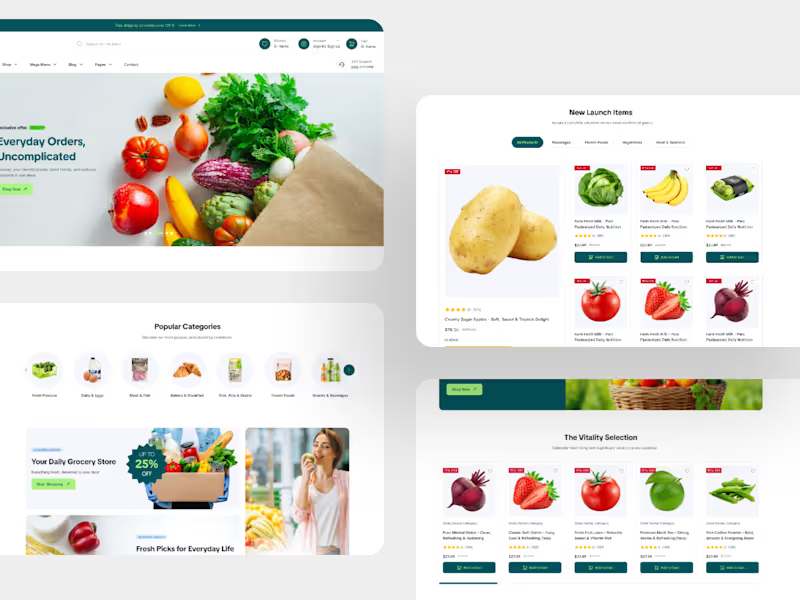
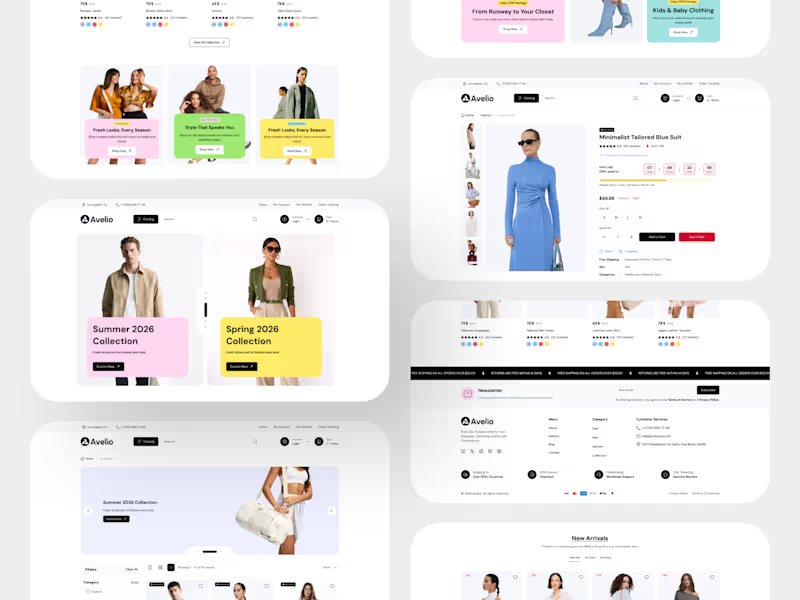
Avelio – Multipurpose eCommerce Websit crafted in Figma
0
2
0
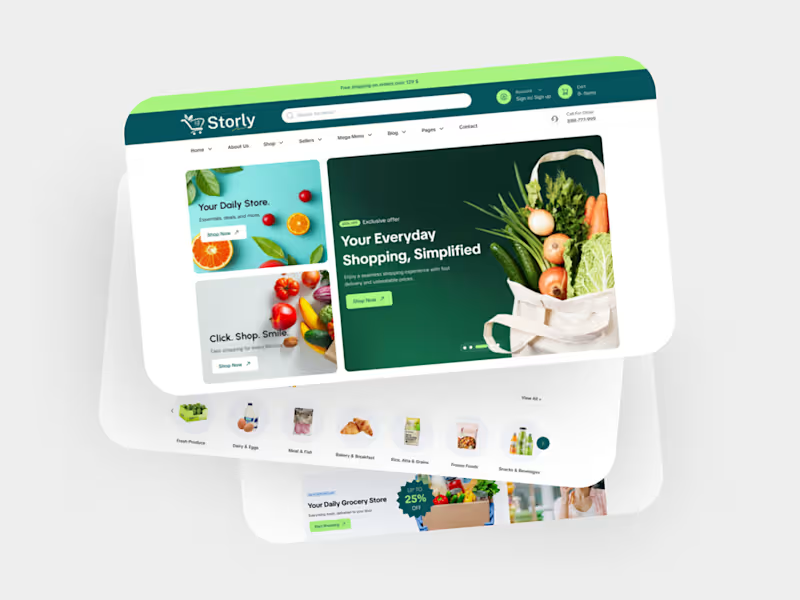
Storly – Multipurpose eCommerce Tailwind CSS Template
0
2
0
Storly – Multipurpose eCommerce Tailwind CSS Template.
0
1
0
Sellzy — Next-Gen Multi-Vendor eCommerce Platform
0
3
Data Visualizer
(5)
Follow
Message
Istiak Ahmed khan
Dhaka, Bangladesh
Power BI Data Analyst + ML AI Automation Expert
5.0
Rating
112
Followers
Follow
Message
Power BI Data Analyst + ML AI Automation Expert
0
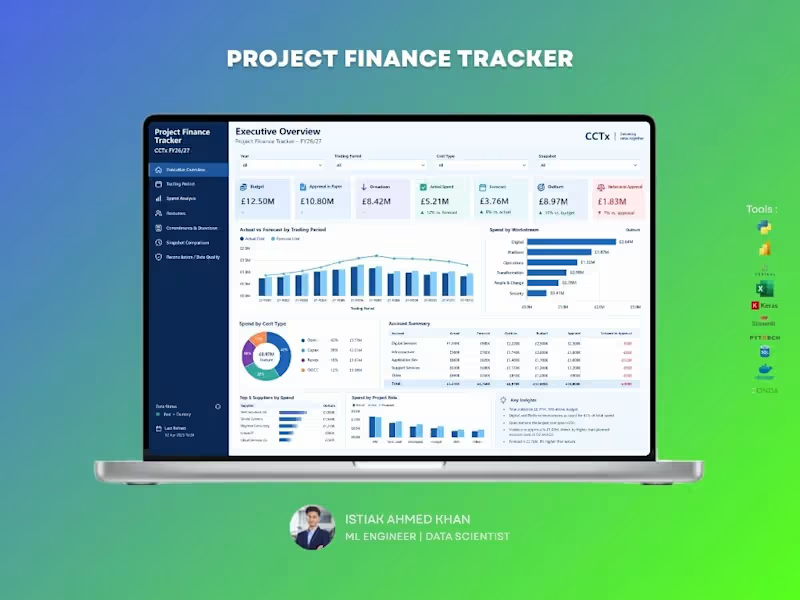
Project Finance Tracker Dashboard A comprehensive dashboard designed to help project teams monitor budgets, actual spending, forecasts, commitments, and financial variances in one place. Track performance by trading period, cost type, workstream, supplier, and project role. Identify overspending, forecast gaps, and approval requirements early to improve financial control, reporting accuracy, and project decision-making.
0
29
7
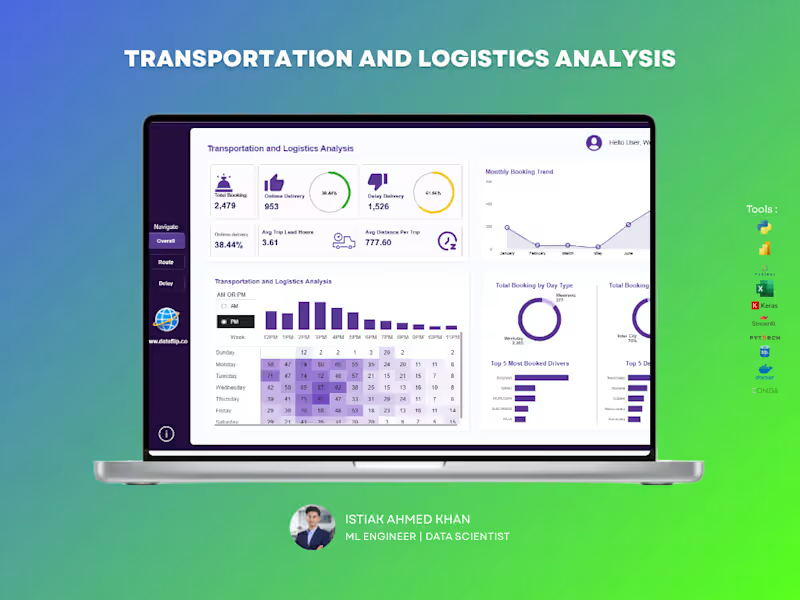
Managing logistics operations without clear insights can lead to delays, inefficiencies, and lost revenue. This dashboard is built to give you complete visibility into your transportation performance — all in one place. A powerful analytics solution that helps you track bookings, delivery performance, delays, and operational efficiency in real time. Designed for clarity and speed, so you can make decisions without digging through raw data. 🔹Monitor on-time vs delayed deliveries instantly 🔹Track booking trends and operational workload over time 🔹Analyze trip efficiency with lead time and distance metrics 🔹Identify peak hours and demand patterns 🔹Evaluate top drivers and most frequent routes/destinations 🔹Compare weekday vs weekend performance If you want a clean, professional dashboard that turns your logistics data into real operational insights, I can build a custom solution tailored to your business needs.
2
7
306
1
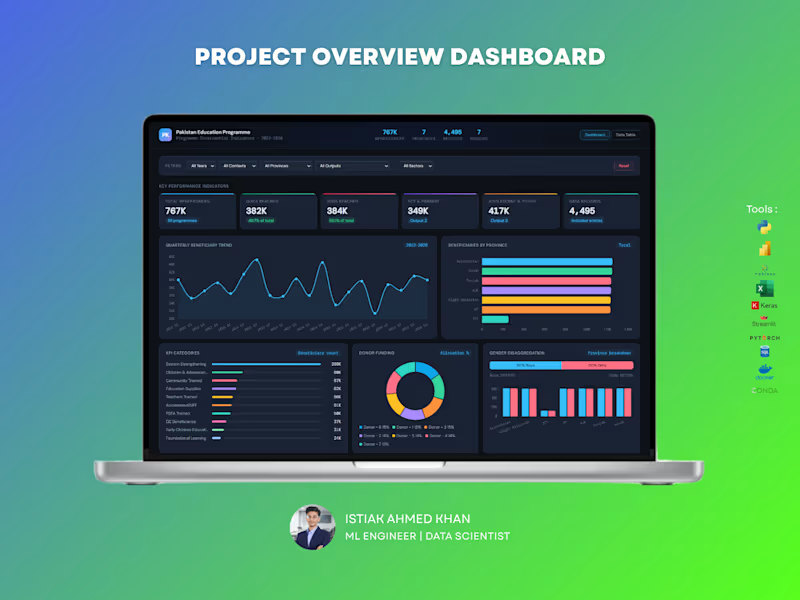
Education Program Analytics Dashboard – Data Analytics Solution Handling large-scale program data without clear visibility can make impact measurement difficult. This dashboard is designed to give organizations a complete, real-time view of program performance, reach, and funding — all in one place. What You Get : A powerful, interactive dashboard that helps track beneficiaries, program outputs, regional performance, and donor contributions with clarity and precision. Key Capabilities: Monitor total beneficiaries and gender distribution Track program reach across provinces and sectors Analyze quarterly trends and growth patterns Evaluate donor funding allocation and impact Identify top-performing program categories and outputs Explore education level distribution and engagement For NGOs and large programs, data is critical for decision-making and reporting. This dashboard helps you measure impact, improve transparency, and optimize resource allocation — making your data meaningful and actionable. Perfect For : NGOs and non-profit organizations Government programs International development agencies Research and policy teams If you want a professional, insight-driven dashboard that clearly communicates impact and performance, I can create a customized solution tailored to your organization.
1
373
10
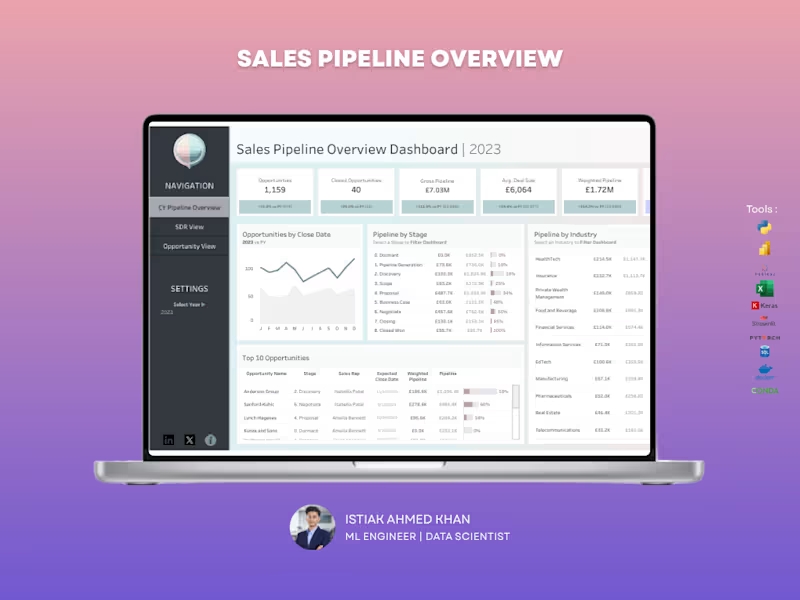
Sales Pipeline Dashboard – Tableau Struggling to track your sales pipeline and forecast revenue accurately? This dashboard gives you a clear, real-time view of your entire sales funnel, helping you stay on top of opportunities and close deals faster. What You Get A centralized Tableau dashboard that brings together pipeline value, deal stages, and performance metrics into one intuitive view. No more scattered reports — everything you need is in one place. Key Capabilities Track total opportunities and closed deals Monitor gross pipeline and weighted pipeline value Analyze pipeline by sales stage to identify bottlenecks Compare pipeline performance across industries View top opportunities and deal progress Understand average deal size and close trends Why It Matters Without visibility into your pipeline, it’s easy to miss opportunities and misjudge forecasts. This dashboard helps you identify stuck deals, improve conversion rates, and predict revenue more accurately. Perfect For Sales teams and managers B2B companies Startups scaling their sales process Agencies managing multiple clients Let’s Build Yours If you want a high-impact Tableau dashboard that turns your sales data into actionable insights, I can create a custom solution tailored to your business.
4
10
431
Data Visualizer
(19)
Follow
Message
Abdul Awal
pro
Dhaka, Bangladesh
Webflow, Framer, Astro, WordPress & Shopify Agency | UI/UX
New to Contra
Follow
Message
Webflow, Framer, Astro, WordPress & Shopify Agency | UI/UX
0
Finance SaaS Website Design
0
3
0
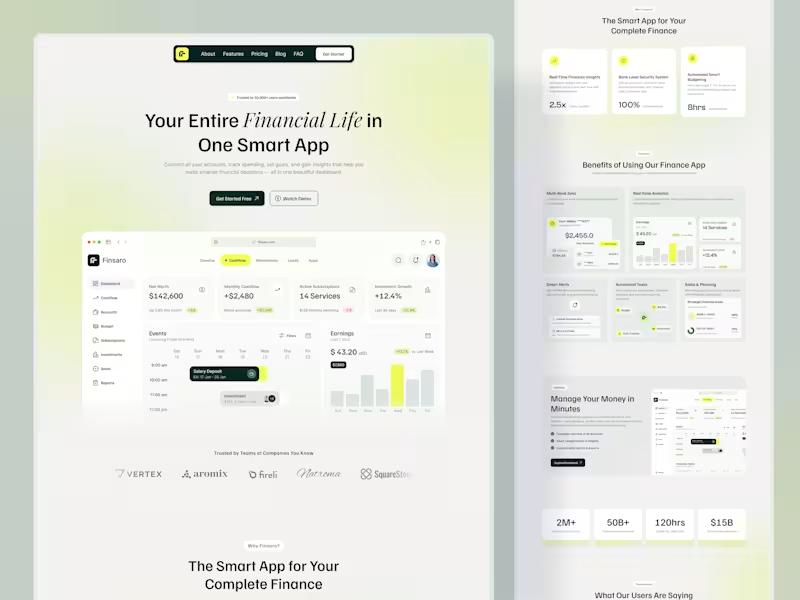
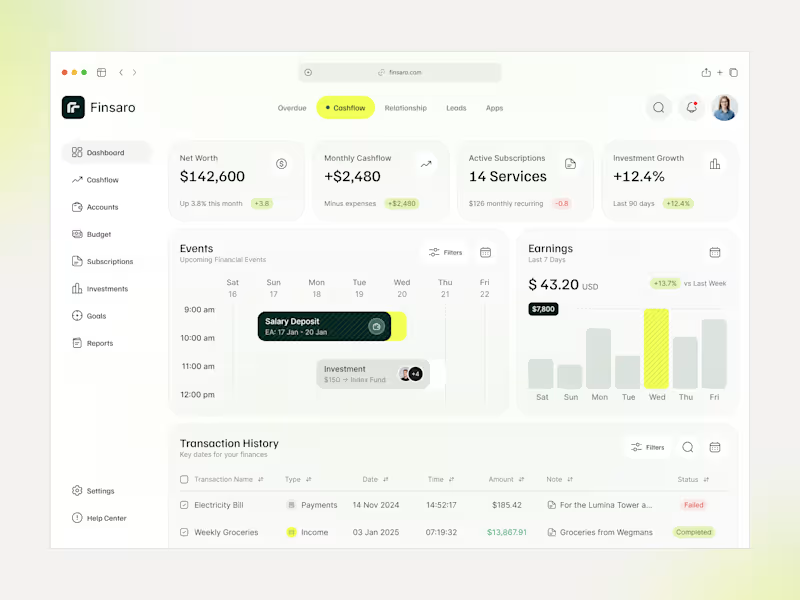
Finsaro — Modern Finance Dashboard for Smarter Business Control
0
4
1
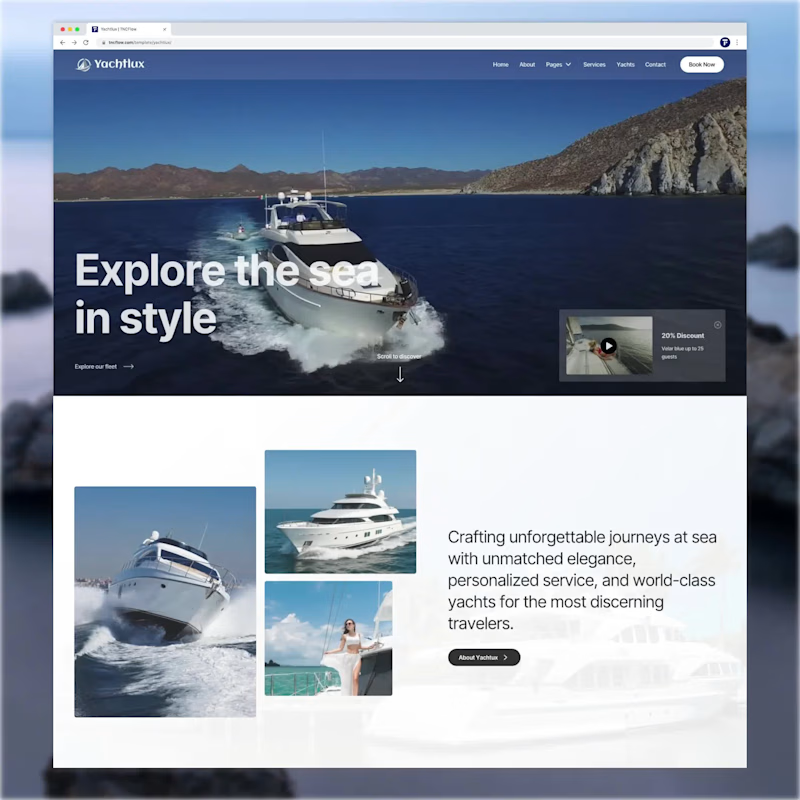
Luxury Yacht Rental Business Website template created as Figma, Webflow, Astro, Framer versions.
1
256
1
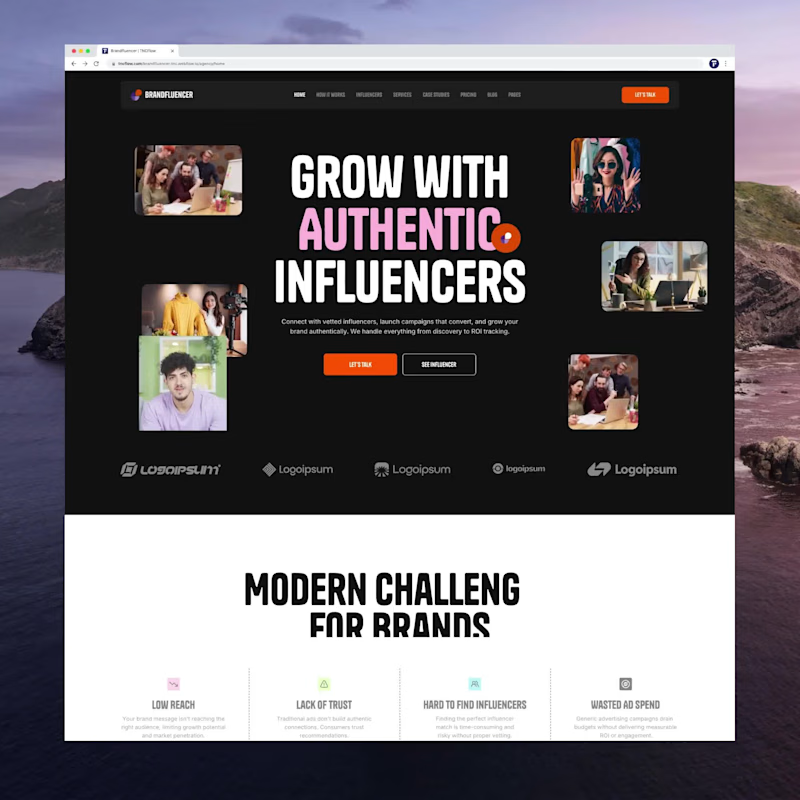
Multipurpose Influencer Marketing Website Template created as Webflow, Framer. Astro, Figma, HTML Versions.
1
255
Data Visualizer
(2)
Follow
Message
Atikur Rahman
Dhaka, Bangladesh
UI/UX Designer for SaaS, Web & Mobile Products
33
Followers
Follow
Message
UI/UX Designer for SaaS, Web & Mobile Products
0
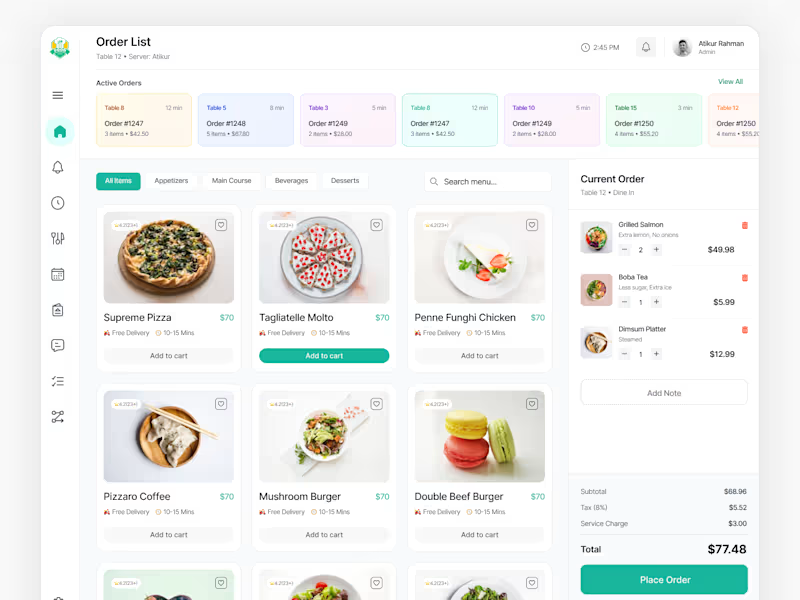
UI/UX Design for Modern Food SaaS Admin Panel
0
1
0
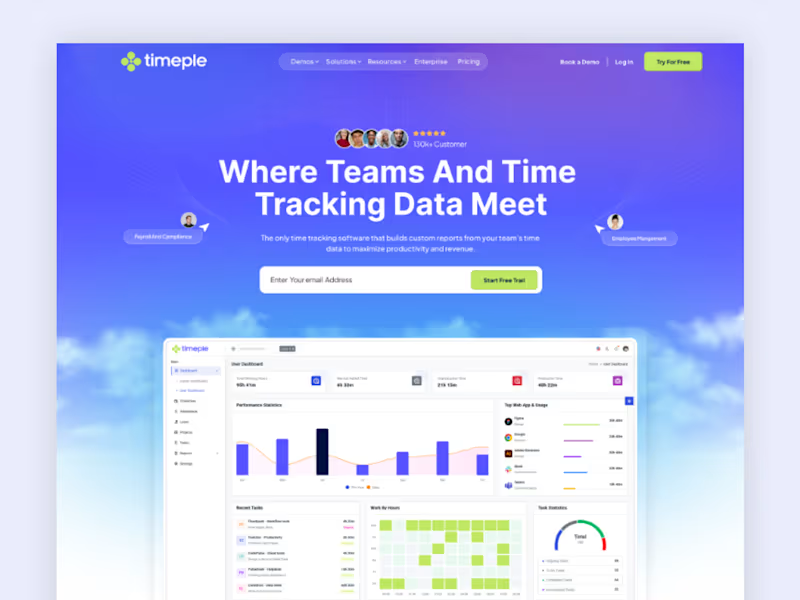
Time Tracking SaaS Landing Page
0
1
0
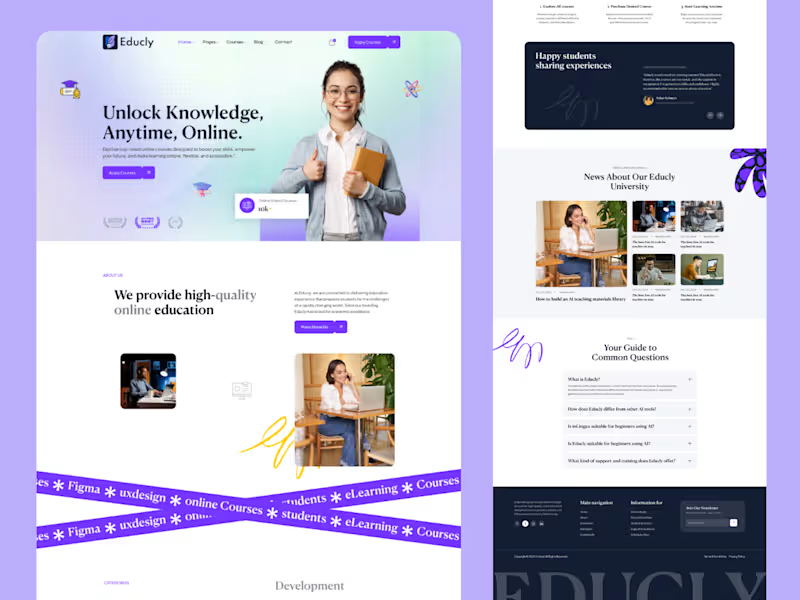
Education Landing page
0
1
0
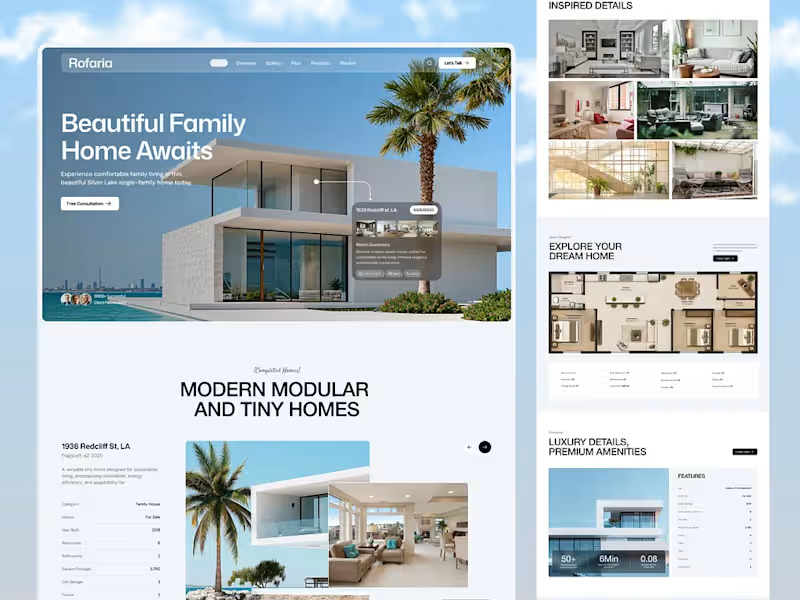
Real Estate Website Design
0
10
Data Visualizer
(3)
Follow
Message
Rabbani Rasha Alvy
Bangladesh
Top notch Product Design
Follow
Message
Top notch Product Design
0
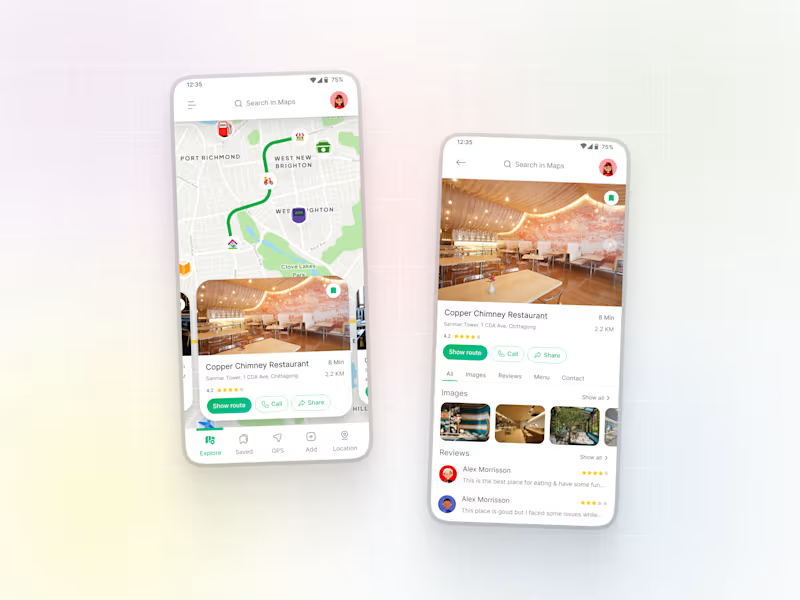
Maps App UI Design
0
2
0
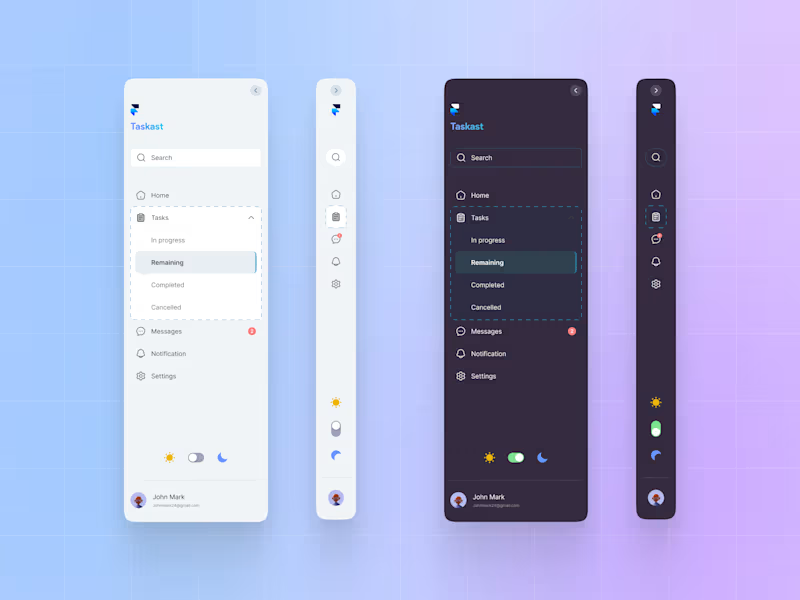
Dashboard Sidebar / Navigation Bar Ui Design
0
4
0
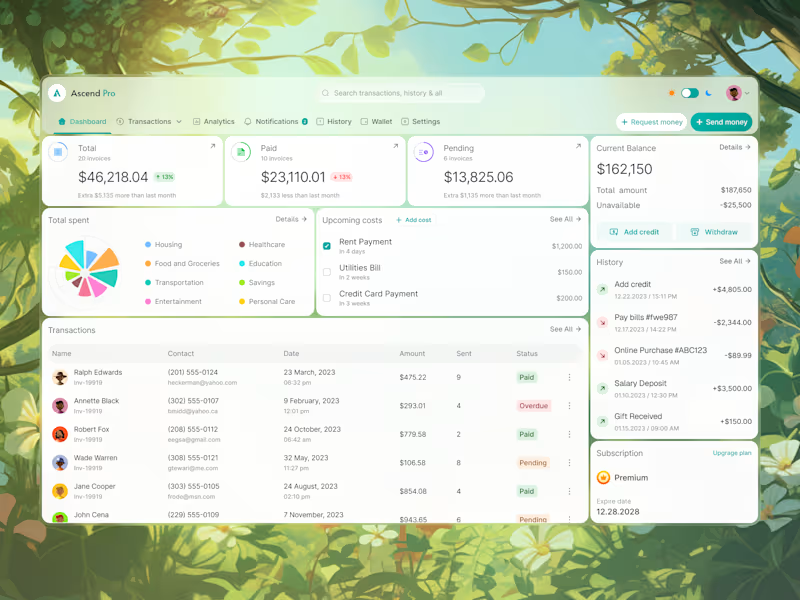
Finance SaaS Dashboard - Ascend Pro
0
4
0
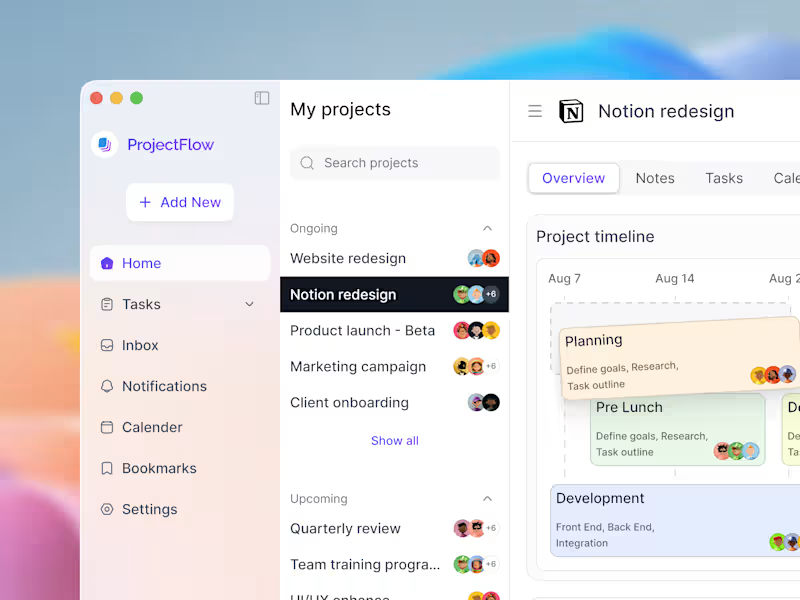
Project Management SaaS Dashboard
0
6
Data Visualizer
(11)
Follow
Message
Sirajul Islam
Dhaka, Bangladesh
Corporate Document & Editorial Designer | InDesign Expert
New to Contra
Follow
Message
Corporate Document & Editorial Designer | InDesign Expert

1
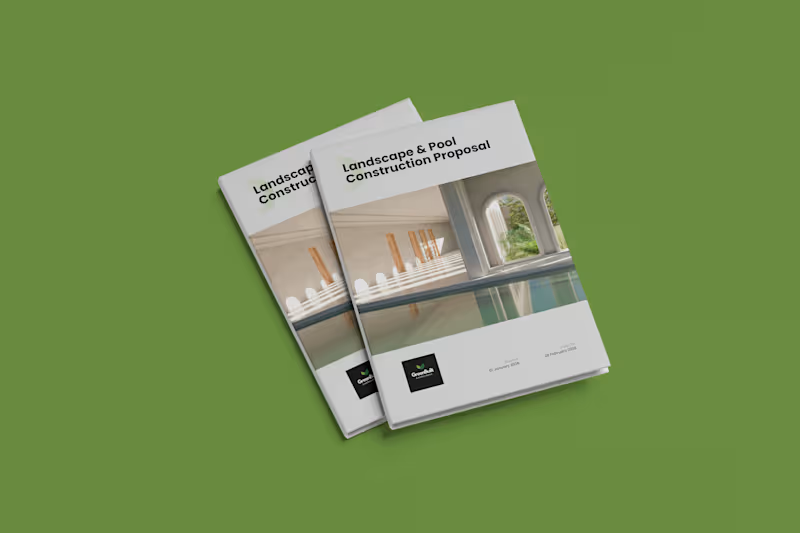
GreenBuilt Landscapes — Landscape & Pool Construction Business Proposal Subtitle / One-Line Summary A premium architectural proposal and capability document designed for an Australian landscape and pool construction firm, balancing high-end project showcases with technical material specifications. Project Overview GreenBuilt Landscapes is a premium landscape architecture and luxury pool construction contractor based in Australia. The goal of this project was to design a comprehensive client pitch proposal and capability catalog that clearly communicates high-value construction services, craftsmanship, and materials to prospective residential and commercial property clients. The challenge was to establish a luxurious, architectural feel that lets high-resolution project photography lead the layout, while maintaining strict typographic structure for service descriptions, material finishes, and technical scope specifications. Role & Scope of Work Role: Lead Editorial & Proposal Layout Designer Services: Multi-page Business Proposal Design Architectural Grid Layout & Visual Hierarchy Material Showcase & Image Grid Curation Custom Icon Integration & Spec Sheet Formatting Print-Ready Prepress & Client-Facing Digital PDF Setup Design Approach & Execution Architectural Grid & Balanced Whitespace: Developed a disciplined, modern editorial layout with generous breathing room, clean section headers, and precise column structures to reflect architectural refinement. Palette & Contrast Strategy: Paired an earthy botanical green accent with crisp neutral tones, introducing an inverted high-contrast dark spread for the Materials, Finishes & Surface Options section to highlight texture swatches and surface selections. Structured Image Systems: Utilized modular photo grids and full-bleed hero spreads across page headers to display completed pool and landscaping builds without visual clutter. Scannable Service Architecture: Integrated minimalist line icons and segmented bullet formatting for service scopes, ensuring complex engineering and design offerings are immediately readable for decision-makers. Production Integrity: Built end-to-end in Adobe InDesign using automated parent pages, structured paragraph styles, and CMYK color separation ready for both high-end print production and fast-loading interactive digital client proposals. Deliverables Print-Ready Proposal PDF (300 DPI, CMYK, Bleeds & Crop Marks) Interactive Digital Screen PDF (Web-optimized for client emailing) Master InDesign (.INDD) Template with Linked Assets & Styles Tools Used Adobe InDesign (Grid Setup, Master Pages & Document Layout) Adobe Illustrator (Vector Iconography & Logo Assets) Adobe Photoshop (Architectural Photo Retouching & Color Correction)
1
204
2
Empathy Engaged Report — Non-Profit Publication & Editorial Layout Design Project Overview The Empathy Engaged Report (Youth Volunteering in a Changing Landscape) is a research-driven publication developed for Volunteer Canada. The project explores shifts in youth engagement, community impact, and volunteer trends across Canada. The objective was to transform extensive academic/field research, qualitative interviews, and statistical data into an authoritative, visually structured, and accessible multi-page report adhering strictly to organizational brand guidelines. Role & Scope of Work Role: Lead Editorial & Publication Designer Services: Editorial Design & Grid Architecture Typography Hierarchy & Layout Systems Data Visualization & Infographic Development Photo Treatment & Visual Curation Print-Ready Prepress & Interactive Digital Distribution Setup Design Approach & Execution Structured Editorial Grid & Hierarchy: Built on a disciplined multi-column baseline grid in Adobe InDesign to balance narrative flow with data density. Utilized clear typographic scale (bold editorial display headings paired with highly legible body copy) to ensure effortless readability. Brand Identity & Color Cohesion: Leveraged Volunteer Canada’s signature red and complementary warm neutrals to create high-contrast callouts, divider spreads, and focal points without overwhelming the content. Data Visualization & Callouts: Designed custom diagrams, statistical callouts (e.g., 74% / 78% impact figures), and iconography to break down complex survey findings into scannable takeaways. Highlighted powerful verbatim quotes on full-spread feature layouts paired with authentic editorial photography. Production & Accessibility: Formatted with comprehensive Paragraph/Character Styles for design consistency. Delivered fully preflighted, print-ready files (CMYK with bleed and crop marks) as well as an optimized, hyperlinked digital PDF for online circulation. Deliverables Print-Ready Multi-Page Publication PDF (Bleeds, Slugs & Pre-flighted) Interactive Digital Screen PDF (Web-optimized) Reusable Master Page & Style Templates in Adobe InDesign Tools Used Adobe InDesign (Editorial Grid, Master Pages & Document Layout) Adobe Illustrator (Vector Infographics & Data Visuals) Adobe Photoshop (Photo Retouching & Contrast Grading)
2
211
1
Bell Rae Realty – Corporate Policy Manual & Real Estate Employee Handbook Design Project Overview Developed a comprehensive, corporate policy manual and internal operational handbook for Bell Rae Realty. Designed to serve as an authoritative standard operating procedure (SOP) and onboarding document, the publication translates corporate governance, company values, and operational guidelines into a polished, structured, and easily navigable editorial format. Key Deliverables & Features Executive Cover & Brand Presentation: Created a clean, trustworthy cover featuring the company’s logo, prominent typography hierarchy, and context-driven real estate imagery to establish an authoritative corporate tone. Structured Table of Contents / Appendix: Designed a dual-column index layout with dot leaders, clean page numbering, and an introductory banner image for seamless section navigation. Mission & Core Values Layout: Arranged brand philosophy and core organizational pillars using a balanced two-page spread, incorporating branded blue icon containers, clear paragraph styling, and supportive workplace photography. Clean Real Estate Visual Language: Implemented a corporate blue and white color system, subtle divider lines, and architectural/team imagery to reinforce professional credibility and brand consistency. Grid Architecture & Production Setup: Built using a modular multi-column grid system, parent/master pages, baseline grid alignment, and accurate margins/bleeds for dual-purpose print production and interactive PDF distribution. Role & Scope Editorial & Publication Layout Design Corporate Typography & Hierarchy Structuring Table of Contents & Document Architecture Setup Photo Masking, Color Balance & Asset Integration Print & Digital Pre-Press Preparation Tools Used Adobe InDesign Adobe Illustrator Adobe Photoshop
1
117
1
Julius Bär – Bond Offering Prospectus & Corporate Investment Brochure Design Project Overview Designed a comprehensive, high-end corporate investment prospectus and informational brochure for the Julius Bär 8.25% Bond Offering. Built specifically for qualified investors, this publication translates dense financial parameters, executive messaging, and regulatory disclosures into an elegant, highly structured, and reader-friendly format aligned with Swiss private wealth branding. Key Deliverables & Features Executive Cover Composition: Crafted an authoritative cover featuring crisp architectural imagery, sharp geometric brand accents, clear typography hierarchy, and a dedicated QR code for seamless digital access. Financial Data & Feature Architecture: Organized complex bond specifications, investment terms, and regulatory compliance points into modular cards, structured comparison grids, and clean iconography for fast visual parsing. Editorial Layout & Typography: Paired refined serif headlines with a modern sans-serif body type to ensure comfortable readability across narrative sections, including the executive letter from the CEO. Corporate Visual Identity: Applied a disciplined color palette of deep navy blue, pure white, and high-resolution urban photography to maintain consistency with global financial market standards. Grid System & Print Pre-Flight: Built with a precise multi-column grid system, parent/master pages, custom paragraph/character styles, and accurate margins/bleeds for flawless print-ready production. Role & Scope Publication & Editorial Layout Design Information Architecture & Data Visualization Image Curation, Masking & Composition Print Production & Pre-Press Formatting Tools Used Adobe InDesign Adobe Illustrator Adobe Photoshop
1
121
Data Visualizer
(2)
Follow
Message
Subrin Al Azad
Dhaka, Bangladesh
Global Product Sourcing, Conversion Optimization, BI Report
5.0
Rating
Follow
Message
Global Product Sourcing, Conversion Optimization, BI Report
0
Marketing Report with Power BI
0
8
0
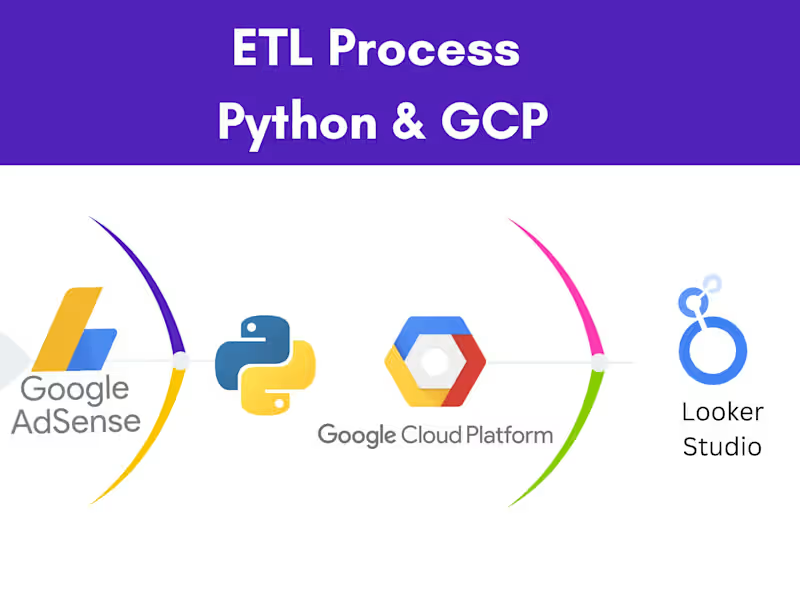
ETL process with Google Cloud Platform
0
32
0
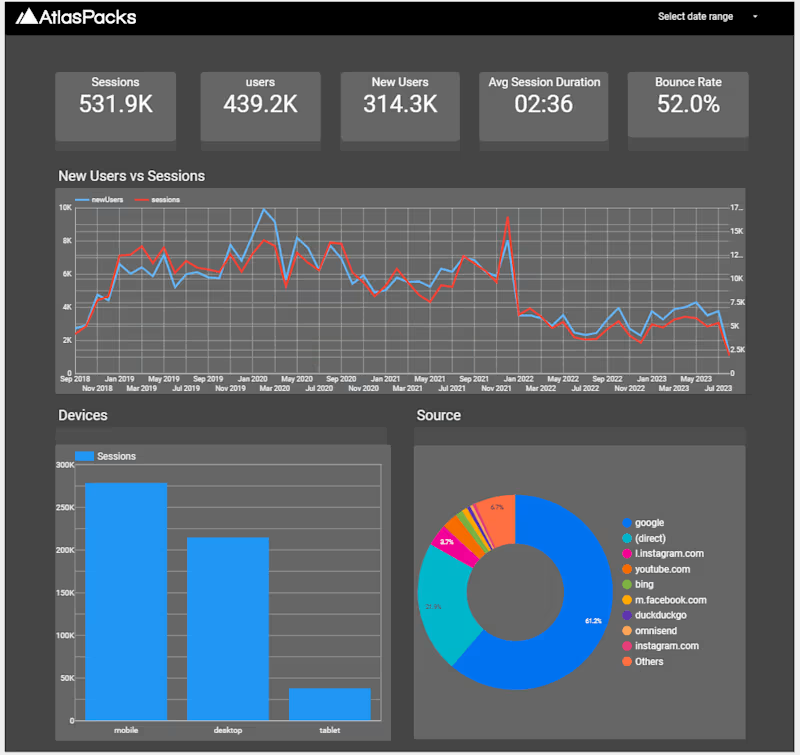
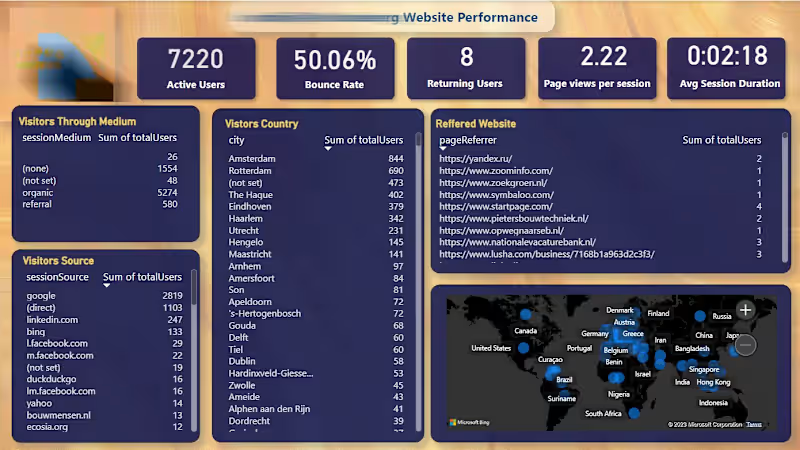
Web Performance Analysis in Looker Studio
0
30
0
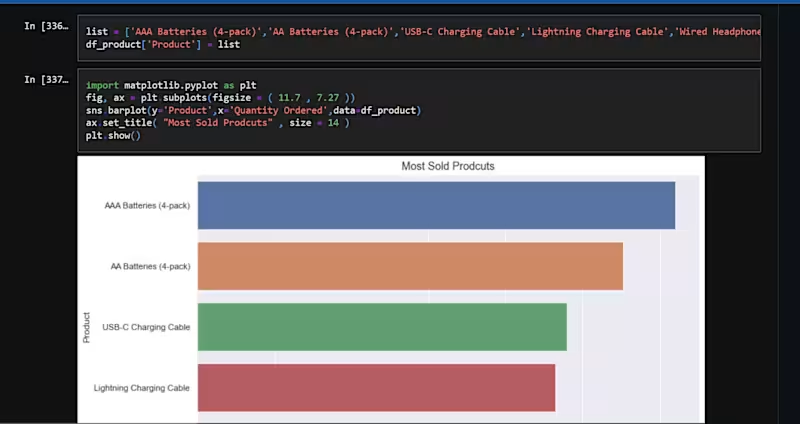
Super Store Data analysis with Python
0
30
Data Visualizer
(5)
Follow
Message
Explore people