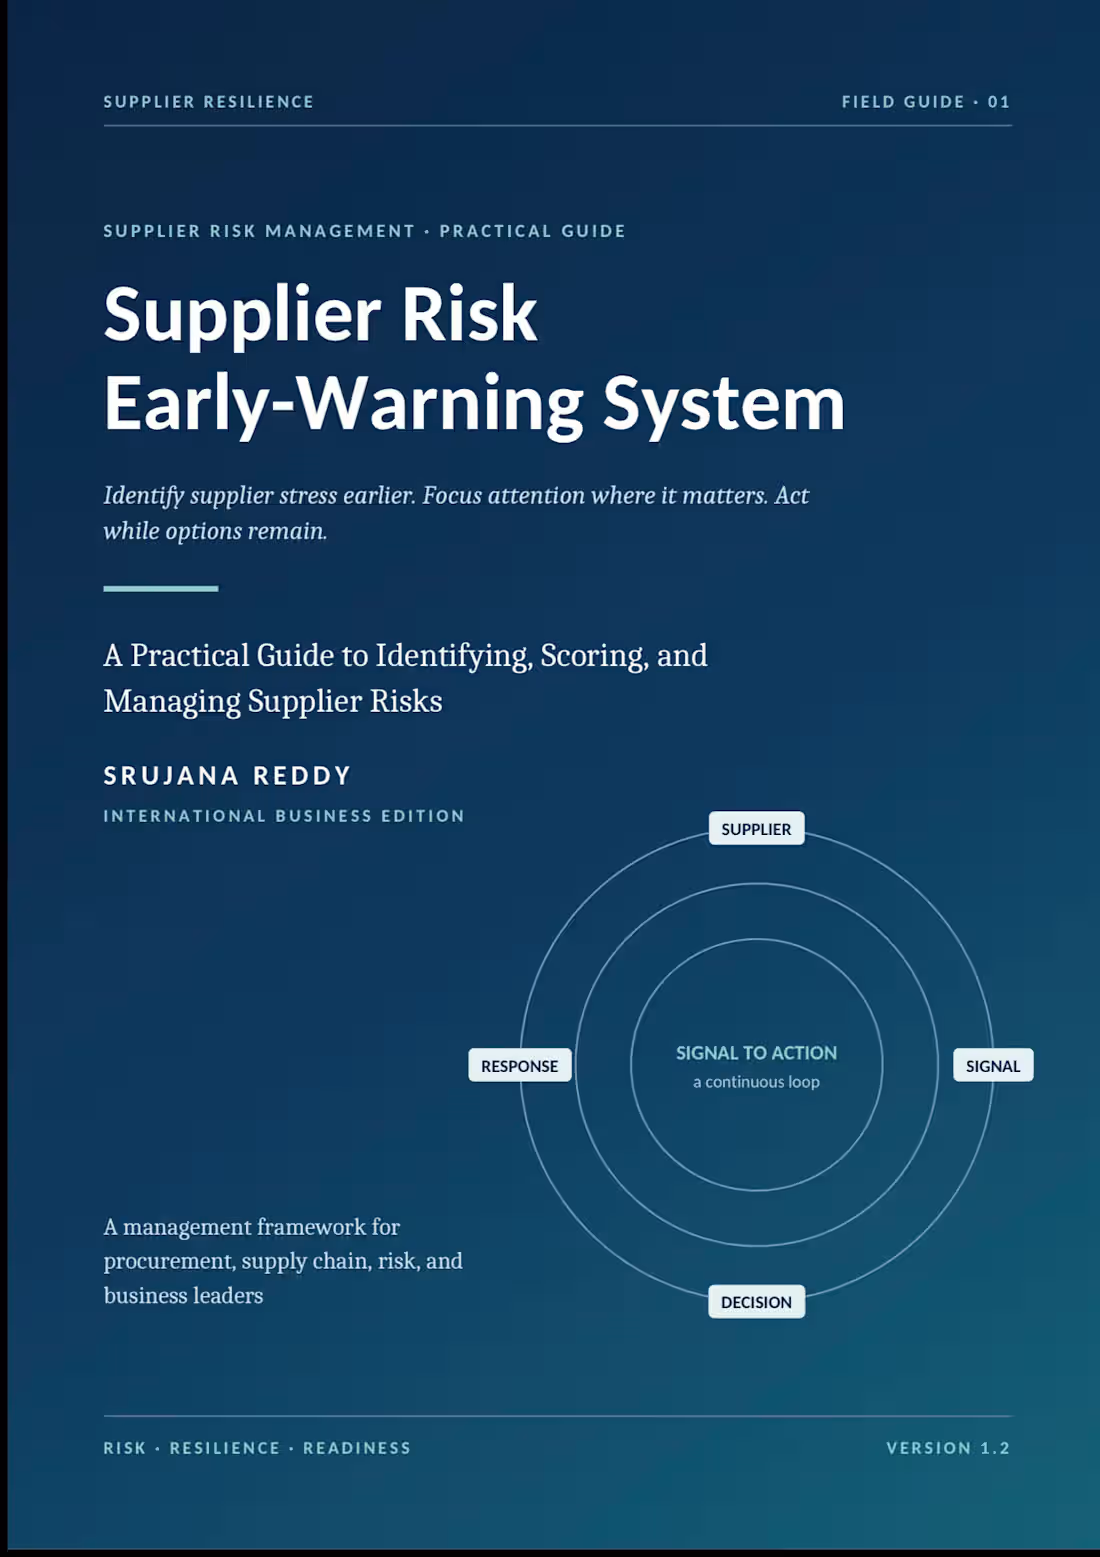
📘✨ A New Practical Guide for Smarter Supplier Risk Management
I’m happy to share my new book — “Supplier Risk Early-Warning System” 🌍📚
In today’s global supply chains, a small supplier warning can sometimes become a major business disruption. ⚠️
This guide is created to help procurement, supply-chain and risk professionals identify warning signs earlier, understand the level of risk, and take action with greater confidence. 🤝📊
Inside the book, you’ll find practical guidance on:
🔎 Identifying supplier risk signals
📊 Assessing and scoring supplier risk
⚠️ Building an early-warning approach
🛡️ Reducing potential supply disruptions
💡 Supporting better procurement decisions
My goal was to create something practical, clear and useful for professionals working with global suppliers — not just another theoretical book. 🌍✨
If supplier risk, procurement or supply-chain resilience is part of your work, I hope you’ll find this guide valuable. 🙌
📖 Available now on Amazon Kindle
https://a.co/d/0cSqzSlE
Thank you for your support and for taking a look at my work! ❤️
Yours
Srujana reddy 🫶🏼
1
0
98

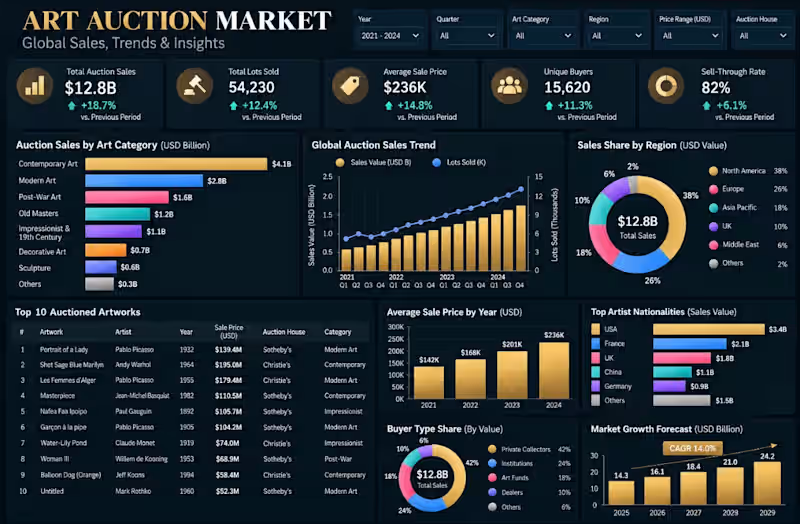
Art Auction Market Intelligence
A professional Art Auction Market Intelligence Dashboard designed to provide a consolidated view of global auction performance, pricing trends, buyer behavior, regional demand, artist markets, and future growth opportunities.
What It Helps With
• Auction Performance — Track total sales, lots sold, average sale price, and sell-through rate.
• Category Analysis — Compare Contemporary Art, Modern Art, Old Masters, Post-War Art, and other categories.
• Market Trend Analysis — Monitor quarterly sales and lot-volume trends to identify market momentum.
• Regional Intelligence — Understand which regions contribute most to overall auction value.
• Artwork & Artist Analysis — Identify high-value artworks, leading artists, and top-performing auction categories.
• Buyer Intelligence — Analyze collector, institutional, fund, and dealer purchasing behavior.
• Pricing Insights — Track average sale prices over time and identify pricing movements.
• Growth Forecasting — Evaluate projected market growth and future revenue opportunities.
Business Value: Helps auction houses, art marketplaces, galleries, collectors, and investment firms make data-driven decisions around pricing, portfolio strategy, buyer targeting, market expansion, and revenue growth.
Client Note:
Built to help auction houses, collectors, and art-market teams evaluate artist performance, auction results, pricing patterns, and emerging market opportunities. The dashboard turns historical auction data into actionable market intelligence.
0
76
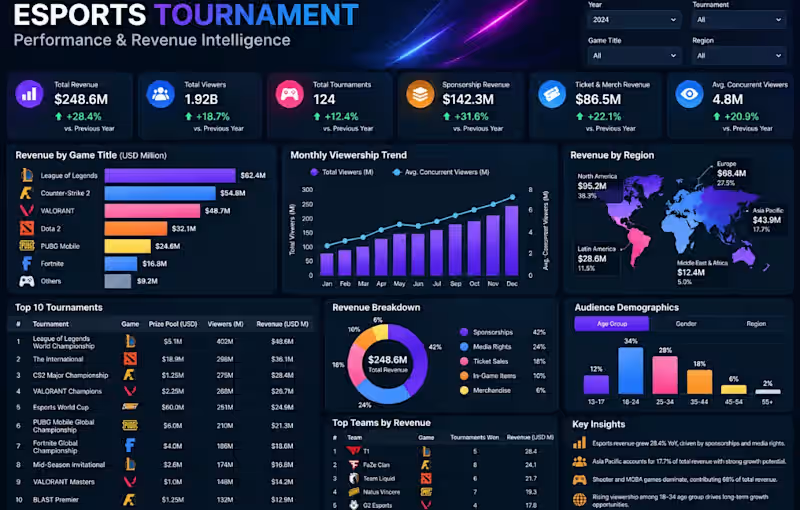
Esports Tournament Performance & Revenue Intelligence
A professional Esports Tournament Performance & Revenue Dashboard that provides a comprehensive view of tournament economics, audience engagement, game performance, sponsorships, regional markets, and team-level results. It brings key business metrics such as $248.6M total revenue, 1.92B viewers, 124 tournaments, $142.3M sponsorship revenue, $86.5M ticket & merchandise revenue, and 4.8M average concurrent viewers into one executive view.
What It Helps With
• Tournament Performance — Measure revenue, viewership, tournament growth, and engagement.
• Revenue Intelligence — Understand sponsorships, media rights, ticket sales, in-game items, and merchandise contribution.
• Game Analysis — Compare revenue performance across major game titles.
• Audience Intelligence — Analyze viewer demographics and identify high-value audience segments.
• Regional Insights — Identify markets with the strongest revenue and growth potential.
• Team Performance — Compare top teams by revenue and tournament wins.
• Sponsorship Strategy — Identify commercial opportunities and evaluate sponsorship contribution.
• Growth Planning — Use viewing and revenue trends to support future tournament and market expansion decisions.
Business Value: Helps esports organizations, tournament operators, gaming platforms, media companies, and sponsors make data-driven decisions around monetization, sponsorships, audience growth, team strategy, and international market expansion
Client Note:
Designed for esports organizations and tournament operators to measure audience growth, competitive performance, sponsorship value, and commercial opportunities. The dashboard brings competitive and business metrics together in one decision-making view.
0
65

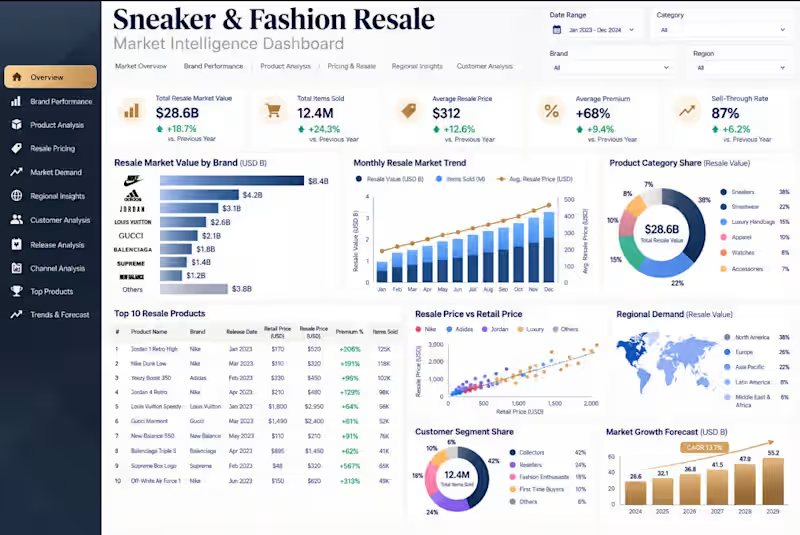
Sneaker & Fashion Resale
A premium Sneaker & Fashion Resale Intelligence Dashboard designed to analyze resale-market performance across sneakers, apparel, accessories, brands, regions, and sales channels.
The dashboard combines sales, resale prices, demand, inventory, margins, brand performance, and market trends into one executive view, helping businesses identify high-value products and profitable resale opportunities.
What It Helps With
• Resale Performance — Track revenue, units sold, average resale price, and profit margins.
• Brand Intelligence — Compare brand performance and identify high-demand brands.
• Product Analysis — Discover best-selling products and products with strong resale premiums.
• Demand Intelligence — Monitor demand trends and identify emerging products.
• Pricing Strategy — Analyze retail vs. resale prices and optimize pricing decisions.
• Inventory Management — Identify fast-moving and slow-moving inventory.
• Market Insights — Compare regional performance and sales-channel trends.
• Growth Strategy — Identify profitable categories and opportunities for market expansion.
Business Value: Helps resale marketplaces, fashion retailers, sneaker businesses, and investors make smarter decisions around pricing, inventory, sourcing, product selection, and revenue growth.
Client Note:
Developed to help resale businesses identify high-demand products, pricing opportunities, profitable releases, and changing consumer preferences. The dashboard provides a consolidated view of retail pricing, resale premiums, inventory, and market demand.
0
53
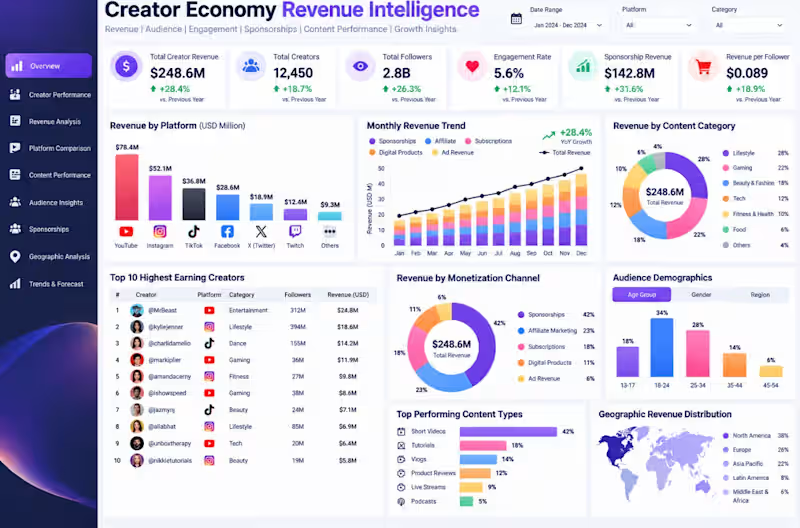
Creator Economy Revenue Intelligence
A professional Creator Economy Revenue Intelligence Dashboard designed to analyze how creators generate revenue across platforms, content formats, sponsorships, subscriptions, digital products, and brand partnerships.
The dashboard brings revenue, engagement, audience growth, monetization performance, and content insights into one executive view.
What It Helps With
• Revenue Analysis — Track revenue across sponsorships, subscriptions, advertising, merchandise, and digital products.
• Creator Performance — Identify high-performing creators and monetization opportunities.
• Audience Intelligence — Analyze audience growth, engagement, demographics, and retention.
• Platform Comparison — Compare revenue and engagement across creator platforms.
• Content Performance — Identify content formats and topics generating the strongest results.
• Sponsorship Intelligence — Evaluate brand partnerships and campaign performance.
• Growth Strategy — Discover scalable revenue streams and opportunities for sustainable growth.
Business Value: Helps creator agencies, media companies, talent managers, and digital platforms make smarter decisions around monetization, partnerships, content strategy, audience growth, and revenue expansion.
Client Note:
Designed to help creator businesses and talent teams understand revenue performance across sponsorships, subscriptions, affiliate marketing, and digital products. The dashboard highlights the channels and content strategies generating the strongest commercial returns.
0
55
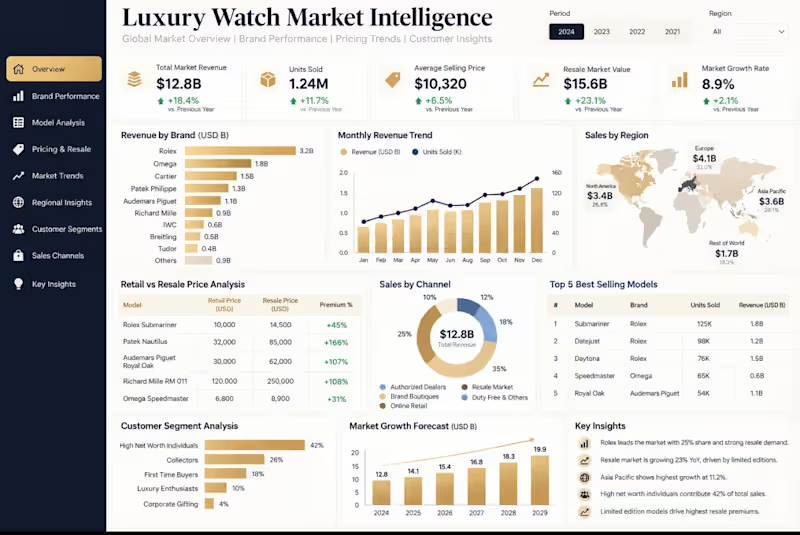
Luxury Watch Market Intelligence
A premium Luxury Watch Market Intelligence Dashboard designed to transform sales, pricing, resale, demand, and regional market data into clear executive-level insights.
The dashboard provides a consolidated view of brand performance, revenue trends, resale premiums, demand signals, customer segments, regional performance, and sales channels, helping luxury watch businesses identify high-performing brands, pricing opportunities, and emerging market trends.
What It Helps With
Brand Performance — Compare revenue, units sold, profitability, and demand across luxury watch brands.
Pricing & Resale Intelligence — Track retail vs. resale pricing and identify watches generating strong resale premiums.
Demand Analysis — Identify high-demand models, changing buyer preferences, and emerging opportunities.
Regional Insights — Understand which markets and regions are driving growth.
Channel Performance — Compare authorized retail, luxury e-commerce, and resale-market performance.
Executive Decision-Making — Turn complex market data into actionable KPIs and visual insights for faster strategic decisions.
Business Value: Helps luxury watch retailers, marketplaces, and investment-focused businesses make smarter decisions around pricing, inventory, brand strategy, market expansion, and revenue growth
Client Note:
Built to help luxury watch brands and retailers understand product demand, pricing trends, inventory performance, and regional market opportunities. The dashboard transforms complex market data into clear insights that support smarter pricing, inventory, and growth decisio
0
43
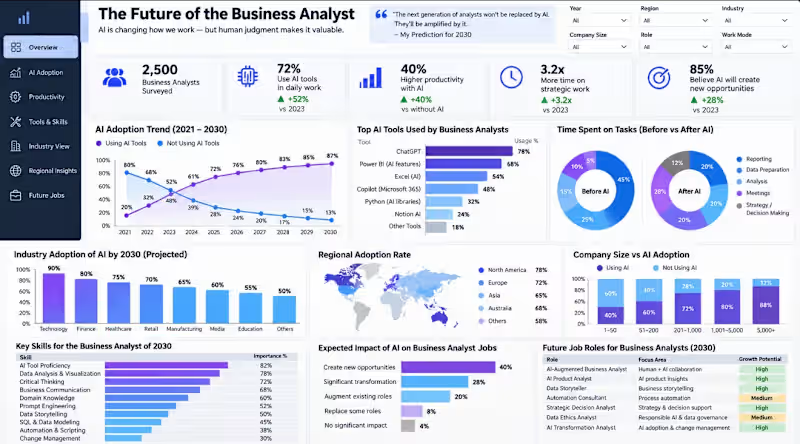
The Future of the Business Analyst — AI Impact Dashboard
I designed this Power BI dashboard to explore how Artificial Intelligence is reshaping the Business Analyst role and changing where analysts spend their time and create value.
The dashboard brings together AI adoption, productivity impact, AI tool usage, task allocation, industry trends, regional adoption, future skills, and emerging Business Analyst roles into a single decision-focused view.
Key Focus Areas
AI adoption trends and future projections
Productivity improvement through AI
Before vs. after AI task allocation
AI tools used in Business Analysis
Industry and regional adoption patterns
Skills required for the next generation of Business Analysts
Emerging AI-driven roles and opportunities
Business Value
The objective is not simply to visualize AI adoption, but to help organizations understand how AI is changing analyst workflows, where automation can create efficiency, and where human judgment remains critical for strategic decision-making.
Tools & Approach: Power BI • Power Query • Data Modelling • DAX • KPI Development • Data Visualization • Business Insights
Client Note
This dashboard is designed as a flexible business intelligence solution and can be customized using your organization’s actual data, KPIs, departments, regions, workflows, and AI adoption metrics.
From raw data to actionable insights — the focus is on building dashboards that support real business decisions, not just reporting.
❤️
0
157
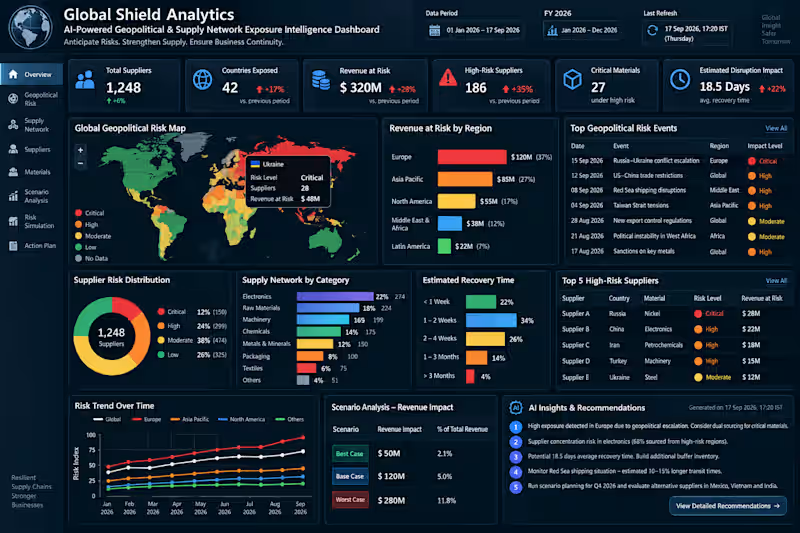
AI-Powered Geopolitical & Supply Network Exposure Intelligence Dashboard
Global supply chains are complex. Understanding where your business is exposed shouldn’t be.
I designed Global Shield Analytics as an executive-level Power BI solution that connects geopolitical risk, supplier dependency, critical materials, operational disruption, recovery time, and financial exposure in one intelligent reporting environment.
Instead of simply showing what happened, the solution is designed to help leadership understand:
Where are we exposed? → What could be affected? → What could it cost? → How long could recovery take? → What should we investigate next?
What I Can Build for Your Business
Every organization has different data, KPIs, reporting processes, and decision-making requirements. I build the Power BI solution around your actual business needs, rather than forcing your data into a generic template.
Requirement Discovery
I understand your reporting challenges, business objectives, KPIs, stakeholders, existing reports, and required outcomes.
Data Preparation
I connect, clean, transform, and structure data from sources such as Excel, SQL, ERP, CRM, and other business systems using Power Query.
Data Modelling
I develop a scalable semantic model with relationships, dimensions, measures, and business logic designed around your reporting requirements.
DAX & KPI Development
I create the calculations required for your business — financial metrics, operational KPIs, supplier performance, risk indicators, trends, targets, and other decision metrics.
Power BI Dashboard Development
I transform the prepared data into a professional, interactive dashboard with executive KPIs, drill-down analysis, filters, trends, comparisons, risk views, and actionable insights.
Business Validation
I validate the calculations and outputs against the agreed requirements and source data so the final reporting solution is consistent and business-ready.
Performance Optimisation
I structure and optimise the model and report for better performance, usability, navigation, and scalability.
Final Delivery
I provide the completed Power BI solution with the agreed reporting structure, visuals, calculations, and handover documentation.
🔗 From Business Requirement to Final Intelligence
Requirement → Data → Power Query → Data Model → DAX → KPIs → Dashboard → Validation → Final Delivery
Whether your organization needs to replace manual Excel reporting, consolidate fragmented data, improve an existing Power BI environment, or build a new executive BI solution, the dashboard can be designed around the specific problem you need to solve.
The Business Value
The goal is not to create more charts.
The goal is to create a single, clear decision-support layer that helps teams understand complex business exposure faster and focus attention where it matters.
Power BI | Microsoft Fabric | SQL | Power Query | DAX | Data Modelling | Executive BI
📅 Dashboard Date: 17 September 2026
📊 Reporting Period: 01 January 2026 – 17 September 2026
🔄 Last Refresh: 17 September 2026, 17:20 IST
Have a Power BI or Business Intelligence requirement?
Share the business problem, reporting challenge, or data requirement. I can design and build the Power BI solution around it — from initial requirements through final delivery.
0
145
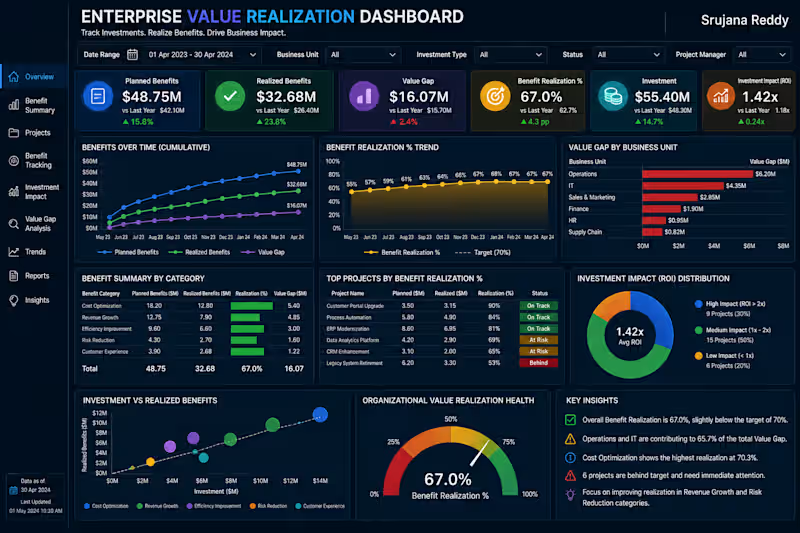
💎 Enterprise Value Realization Dashboard
Track Investments. Realize Benefits. Drive Business Impact.
The Enterprise Value Realization Dashboard is a professional Business Intelligence solution designed to measure whether business projects and investments are delivering their promised benefits. It provides a centralized view of planned benefits, realized benefits, value gaps, benefit realization rates, and investment impact, enabling leadership to understand where investments are creating value and where corrective action is required.
With interactive analytics, this dashboard helps organizations monitor project outcomes, identify benefit gaps, prioritize underperforming investments, and improve overall return on strategic initiatives.
📊 Key Metrics
Planned Benefits
Realized Benefits
Value Gap
Benefit Realization %
Investment Impact (ROI)
Overall Value Realization Score
📈 Dashboard Features
Executive Value Realization KPI Overview
Planned vs Realized Benefits Analysis
Benefit Realization Trend
Business Unit Value Gap Analysis
Project Benefit Performance
Investment Impact & ROI Analysis
Investment vs Realized Benefits
Executive Insights & Recommendations
💼 Business Value
This dashboard helps organizations:
Measure actual benefits against planned outcomes
Identify projects with significant value gaps
Track investment performance and ROI
Prioritize initiatives requiring corrective action
Improve benefit realization across business units
Support data-driven investment decisions
Designed by:
Srujana Reddy | Business Analyst
Transforming investment and project data into actionable insights that measure realized value, identify performance gaps, and improve strategic business outcomes.
💼 Client Note
Thank you for exploring my portfolio.
The Enterprise Value Realization Dashboard is a professional Power BI solution designed to help organizations measure whether strategic projects and investments are delivering their expected business benefits. It provides clear visibility into planned versus realized benefits, value gaps, benefit realization rates, and investment impact, enabling leadership to identify underperforming initiatives and focus resources where they can create the greatest value.
I specialize in developing modern, interactive Power BI dashboards that transform project, investment, and financial data into actionable insights for strategic decision-making.
Services I Offer
Enterprise Value Realization Dashboards
Investment & ROI Analytics
Project Portfolio Analytics
Strategic KPI Dashboards
Benefit Tracking & Performance Reporting
Interactive Power BI Reports
Advanced DAX & Data Modeling
Custom Business Intelligence Solutions
What You Can Expect
Executive-Level Dashboard Design
Interactive & User-Friendly Reports
Advanced DAX & Data Modeling
Real-Time Benefit & Investment KPI Monitoring
Business-Focused Visualizations
Customized Solutions Tailored to Your Business Needs
Every dashboard I develop is designed to measure realized business value, identify benefit gaps, evaluate investment performance, and provide leadership with clear insights for better resource allocation and strategic execution.
If you're looking for a custom Power BI Enterprise Value Realization Dashboard to measure project outcomes, track investment impact, and improve benefit realization, I'd be happy to collaborate on your next project.
Let's transform your investment data into actionable insights that maximize realized value, improve ROI, and drive measurable business outcomes.
0
239
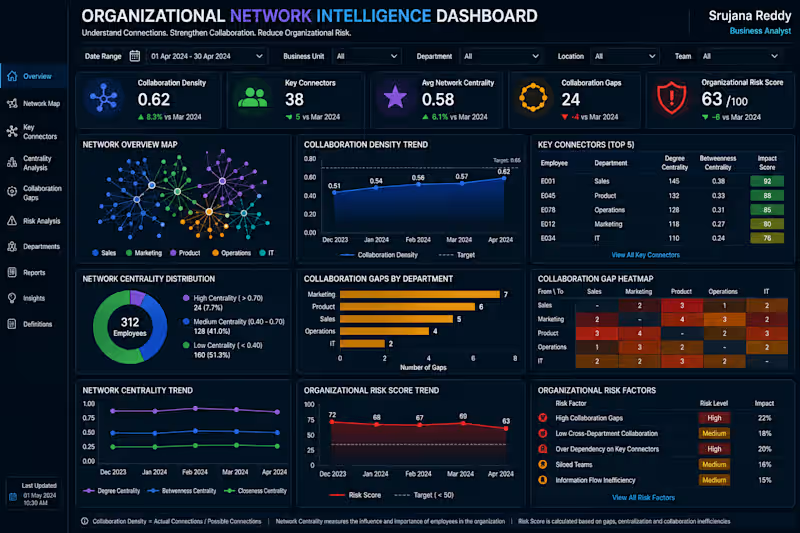
🧠 Organizational Network Intelligence Dashboard
Understand Connections. Strengthen Collaboration. Reduce Organizational Risk.
The Organizational Network Intelligence Dashboard is a professional Business Intelligence solution designed to analyze how information, collaboration, and relationships flow across an organization. It provides a centralized view of collaboration density, key connectors, network centrality, collaboration gaps, and organizational risk, helping leadership understand communication patterns and identify areas that need stronger cross-functional collaboration.
With interactive network analytics, this dashboard helps organizations identify influential connectors, detect collaboration gaps, improve information flow, and reduce organizational dependency and communication risks.
📊 Key Metrics
Collaboration Density
Key Connectors
Network Centrality
Collaboration Gaps
Organizational Risk Score
Collaboration Health Score
📈 Dashboard Features
Executive Network KPI Overview
Interactive Organizational Network Map
Key Connector Analysis
Network Centrality Trends
Department Collaboration Gap Analysis
Collaboration Gap Heatmap
Organizational Risk Monitoring
Executive Insights & Recommendations
💼 Business Value
This dashboard helps organizations:
Understand collaboration patterns across teams
Identify key employees who connect different groups
Detect cross-department collaboration gaps
Improve information flow and knowledge sharing
Identify organizational network risks
Support data-driven organizational planning
Designed by:
Srujana Reddy | Business Analyst
Transforming organizational network data into actionable insights that strengthen collaboration, improve information flow, and build a more connected and resilient organization.
💼 Client Note
Thank you for exploring my portfolio.
The Organizational Network Intelligence Dashboard is a professional Power BI solution designed to help organizations understand collaboration patterns, information flow, and cross-functional relationships. It provides visibility into collaboration density, key connectors, network centrality, collaboration gaps, and organizational risk, helping leadership identify communication bottlenecks and strengthen collaboration across teams.
I specialize in developing modern, interactive Power BI dashboards that transform complex organizational data into actionable insights for better workforce planning, collaboration, and business decision-making.
Services I Offer
Organizational Network Intelligence Dashboards
Collaboration & Workforce Analytics
Executive KPI Dashboards
Cross-Department Performance Analytics
Organizational Risk Reporting
Interactive Power BI Reports
Advanced DAX & Data Modeling
Custom Business Intelligence Solutions
What You Can Expect
Executive-Level Dashboard Design
Interactive & User-Friendly Reports
Advanced DAX & Data Modeling
Collaboration & Network KPI Monitoring
Business-Focused Visualizations
Customized Solutions Tailored to Your Business Needs
Every dashboard I develop is designed to identify collaboration gaps, understand organizational connections, improve information flow, and provide leadership with actionable insights for stronger organizational performance.
If you're looking for a custom Power BI Organizational Network Intelligence Dashboard to analyze collaboration, identify network risks, and improve cross-functional connectivity, I'd be happy to collaborate on your next project.
Let's transform your organizational data into actionable insights that strengthen collaboration, reduce communication gaps, and drive better business outcomes. 🚀
1
344
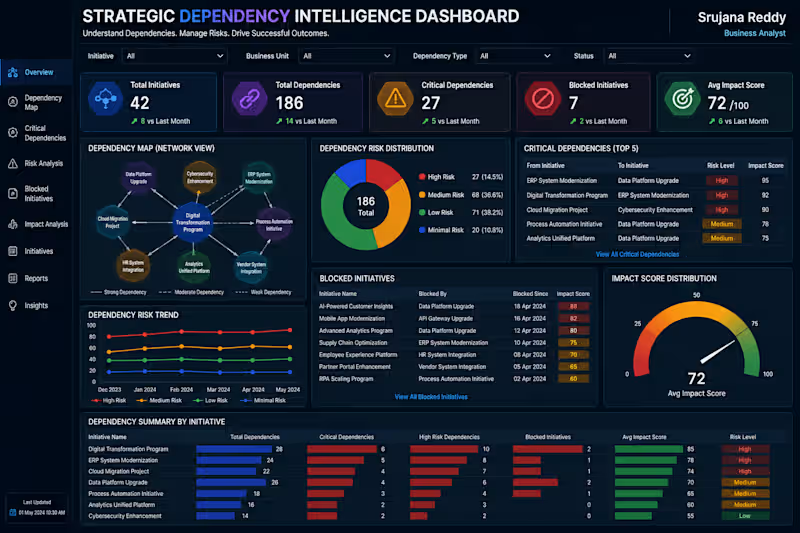
🔗 Strategic Dependency Intelligence Dashboard
Understand Dependencies. Manage Risk. Protect Strategic Outcomes.
The Strategic Dependency Intelligence Dashboard is a professional Business Intelligence solution designed to help organizations identify how strategic initiatives depend on other teams, systems, projects, and business capabilities. It provides a centralized view of dependency relationships, critical dependencies, dependency risks, blocked initiatives, and overall impact scores.
With interactive analytics, this dashboard helps leadership identify high-risk dependencies early, reduce project delays, prioritize critical actions, and improve coordination across strategic initiatives.
📊 Key Metrics
Dependency Map
Critical Dependencies
Dependency Risk
Blocked Initiatives
Impact Score
Overall Dependency Health
📈 Dashboard Features
Executive Dependency KPI Overview
Interactive Dependency Network Map
Critical Dependency Analysis
Dependency Risk Trend Monitoring
Blocked Initiative Tracking
Impact Score Analysis
Initiative & Business Unit Comparison
Executive Insights & Recommendations
💼 Business Value
This dashboard helps organizations:
Identify critical dependencies early
Reduce initiative delays and blockers
Prioritize high-impact risks
Improve cross-team coordination
Understand dependency-driven business impact
Support data-driven strategic planning
Designed by:
Srujana Reddy | Business Analyst
Transforming dependency data into actionable insights that reduce strategic risk, remove blockers, and improve successful execution of enterprise initiatives.
💼 Client Note
Thank you for exploring my portfolio.
The Strategic Dependency Intelligence Dashboard is a professional Power BI solution designed to help organizations understand and manage dependencies across strategic initiatives, teams, systems, and projects. It provides clear visibility into critical dependencies, dependency risks, blocked initiatives, and impact scores, enabling leadership to identify potential delays and prioritize high-impact actions.
I specialize in building modern, interactive Power BI dashboards that transform complex business relationships and operational data into actionable insights for strategic decision-making.
Services I Offer
Strategic Dependency Dashboards
Project & Initiative Analytics
Risk & Impact Analysis
Executive KPI Dashboards
Portfolio Performance Reporting
Interactive Power BI Reports
Advanced DAX & Data Modeling
Custom Business Intelligence Solutions
What You Can Expect
Executive-Level Dashboard Design
Interactive & User-Friendly Reports
Advanced DAX & Data Modeling
Dependency & Risk KPI Monitoring
Business-Focused Visualizations
Customized Solutions Tailored to Your Business Needs
Every dashboard I develop is designed to identify critical dependencies, reduce blockers, improve cross-functional coordination, and provide leadership with clear insights for faster strategic execution.
If you're looking for a custom Power BI Strategic Dependency Dashboard to identify project dependencies, manage risks, and improve initiative execution, I'd be happy to collaborate on your next project.
Let's transform your dependency data into actionable insights that reduce strategic risk, remove bottlenecks, and drive successful business outcomes. 🚀
1
206
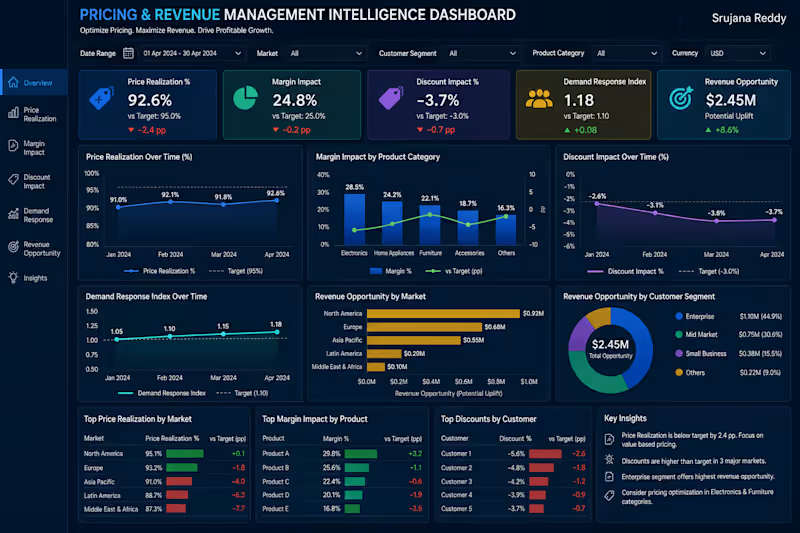
💰 Pricing & Revenue Management Intelligence Dashboard
Optimize Pricing. Protect Margins. Maximize Revenue.
The Pricing & Revenue Management Intelligence Dashboard is a professional Business Intelligence solution designed to help organizations evaluate pricing performance across markets, customer segments, and product categories. It provides a centralized view of price realization, margin impact, discount impact, demand response, and revenue opportunities, enabling commercial teams to identify pricing gaps and improve profitability.
With interactive analytics and clear KPI tracking, this dashboard helps businesses understand customer response to pricing changes, optimize discounts, identify high-value markets, and make data-driven pricing decisions.
📊 Key Metrics
Price Realization
Margin Impact
Discount Impact
Demand Response
Revenue Opportunity
Pricing Performance Score
📈 Dashboard Features
Executive Pricing KPI Overview
Price Realization Trend Analysis
Product-wise Margin Analysis
Discount Impact Monitoring
Demand Response Analysis
Market-wise Revenue Opportunity
Customer Segment Analysis
Pricing Insights & Recommendations
💼 Business Value
This dashboard helps organizations:
Identify pricing gaps against targets
Protect profit margins
Optimize discount strategies
Understand demand response
Discover revenue growth opportunities
Improve pricing decisions across markets and customers
Designed by:
Srujana Reddy | Business Analyst
Transforming pricing data into actionable insights that improve margins, unlock revenue opportunities, and drive profitable business growth.
💼 Client Note
Thank you for exploring my portfolio.
The Pricing & Revenue Management Intelligence Dashboard is a professional Power BI solution designed to help organizations optimize pricing strategies, protect profit margins, and identify revenue growth opportunities. It provides clear visibility into price realization, margin impact, discount performance, demand response, and potential revenue opportunities across markets, products, and customer segments.
I specialize in developing modern, interactive Power BI dashboards that transform commercial and financial data into actionable insights, helping businesses improve pricing decisions and maximize profitable growth.
Services I Offer
Pricing & Revenue Management Dashboards
Revenue & Margin Analytics
Pricing Performance Reporting
Customer & Market Analytics
Executive KPI Dashboards
Interactive Power BI Reports
Advanced DAX & Data Modeling
Custom Business Intelligence Solutions
What You Can Expect
Executive-Level Dashboard Design
Interactive & User-Friendly Reports
Advanced DAX & Data Modeling
Pricing & Revenue KPI Monitoring
Business-Focused Visualizations
Customized Solutions Tailored to Your Business Needs
Every dashboard I develop is designed to identify pricing gaps, optimize discounts, protect margins, uncover revenue opportunities, and support smarter commercial decisions.
If you're looking for a custom Power BI Pricing & Revenue Management Dashboard to optimize pricing, improve profitability, and identify growth opportunities, I'd be happy to collaborate on your next project.
Let's transform your pricing data into actionable insights that strengthen margins, maximize revenue, and drive profitable business growth. 🚀
1
196