Business Analyst | Power BI Dashboard Expert | Excel Automat
- 12
- Followers
Business Analyst | Power BI Dashboard Expert | Excel Automat
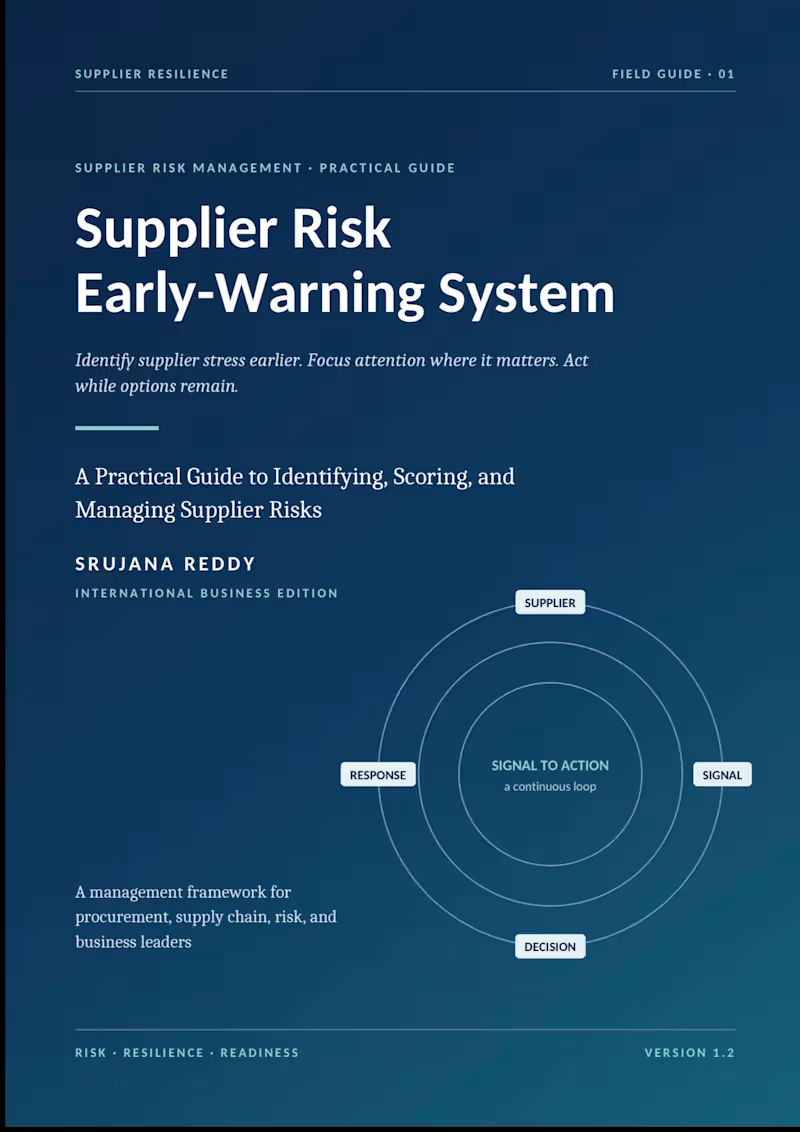
📘✨ A New Practical Guide for Smarter Supplier Risk Management
I’m happy to share my new book — “Supplier Risk Early-Warning System” 🌍📚
In today’s global supply chains, a small supplier warning can sometimes become a major business disruption. ⚠️
This guide is created to help procurement, supply-chain and risk professionals identify warning signs earlier, understand the level of risk, and take action with greater confidence. 🤝📊
Inside the book, you’ll find practical guidance on:
🔎 Identifying supplier risk signals
📊 Assessing and scoring supplier risk
⚠️ Building an early-warning approach
🛡️ Reducing potential supply disruptions
💡 Supporting better procurement decisions
My goal was to create something practical, clear and useful for professionals working with global suppliers — not just another theoretical book. 🌍✨
If supplier risk, procurement or supply-chain resilience is part of your work, I hope you’ll find this guide valuable. 🙌
📖 Available now on Amazon Kindle
https://a.co/d/0cSqzSlE
Thank you for your support and for taking a look at my work! ❤️
Yours
Srujana reddy 🫶🏼
1
0
98
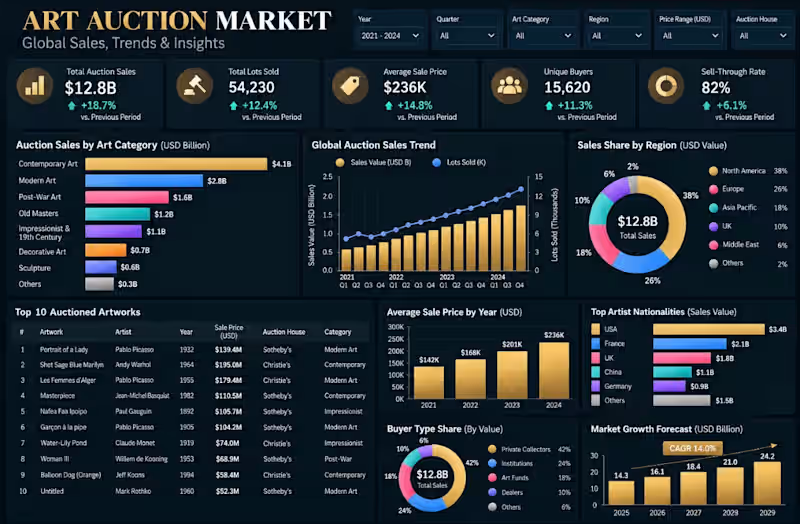
Art Auction Market Intelligence
A professional Art Auction Market Intelligence Dashboard designed to provide a consolidated view of global auction performance, pricing trends, buyer behavior, regional demand, artist markets, and future growth opportunities.
What It Helps With
• Auction Performance — Track total sales, lots sold, average sale price, and sell-through rate.
• Category Analysis — Compare Contemporary Art, Modern Art, Old Masters, Post-War Art, and other categories.
• Market Trend Analysis — Monitor quarterly sales and lot-volume trends to identify market momentum.
• Regional Intelligence — Understand which regions contribute most to overall auction value.
• Artwork & Artist Analysis — Identify high-value artworks, leading artists, and top-performing auction categories.
• Buyer Intelligence — Analyze collector, institutional, fund, and dealer purchasing behavior.
• Pricing Insights — Track average sale prices over time and identify pricing movements.
• Growth Forecasting — Evaluate projected market growth and future revenue opportunities.
Business Value: Helps auction houses, art marketplaces, galleries, collectors, and investment firms make data-driven decisions around pricing, portfolio strategy, buyer targeting, market expansion, and revenue growth.
Client Note:
Built to help auction houses, collectors, and art-market teams evaluate artist performance, auction results, pricing patterns, and emerging market opportunities. The dashboard turns historical auction data into actionable market intelligence.
0
76
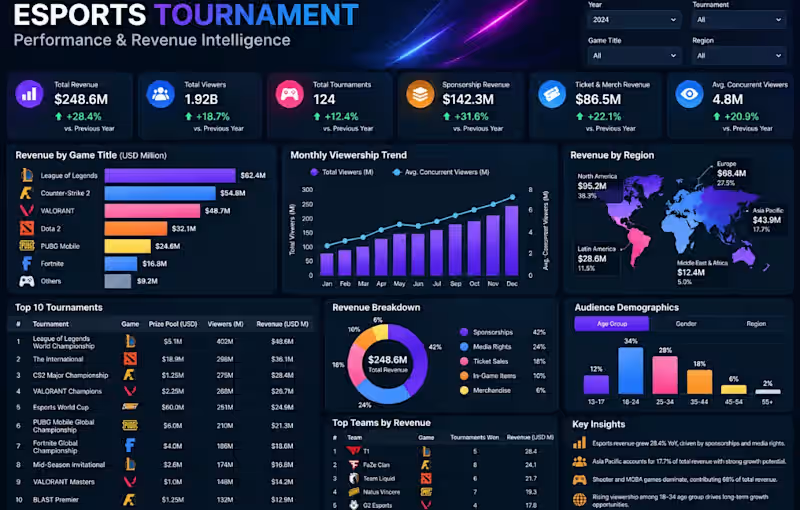
Esports Tournament Performance & Revenue Intelligence
A professional Esports Tournament Performance & Revenue Dashboard that provides a comprehensive view of tournament economics, audience engagement, game performance, sponsorships, regional markets, and team-level results. It brings key business metrics such as $248.6M total revenue, 1.92B viewers, 124 tournaments, $142.3M sponsorship revenue, $86.5M ticket & merchandise revenue, and 4.8M average concurrent viewers into one executive view.
What It Helps With
• Tournament Performance — Measure revenue, viewership, tournament growth, and engagement.
• Revenue Intelligence — Understand sponsorships, media rights, ticket sales, in-game items, and merchandise contribution.
• Game Analysis — Compare revenue performance across major game titles.
• Audience Intelligence — Analyze viewer demographics and identify high-value audience segments.
• Regional Insights — Identify markets with the strongest revenue and growth potential.
• Team Performance — Compare top teams by revenue and tournament wins.
• Sponsorship Strategy — Identify commercial opportunities and evaluate sponsorship contribution.
• Growth Planning — Use viewing and revenue trends to support future tournament and market expansion decisions.
Business Value: Helps esports organizations, tournament operators, gaming platforms, media companies, and sponsors make data-driven decisions around monetization, sponsorships, audience growth, team strategy, and international market expansion
Client Note:
Designed for esports organizations and tournament operators to measure audience growth, competitive performance, sponsorship value, and commercial opportunities. The dashboard brings competitive and business metrics together in one decision-making view.
0
65
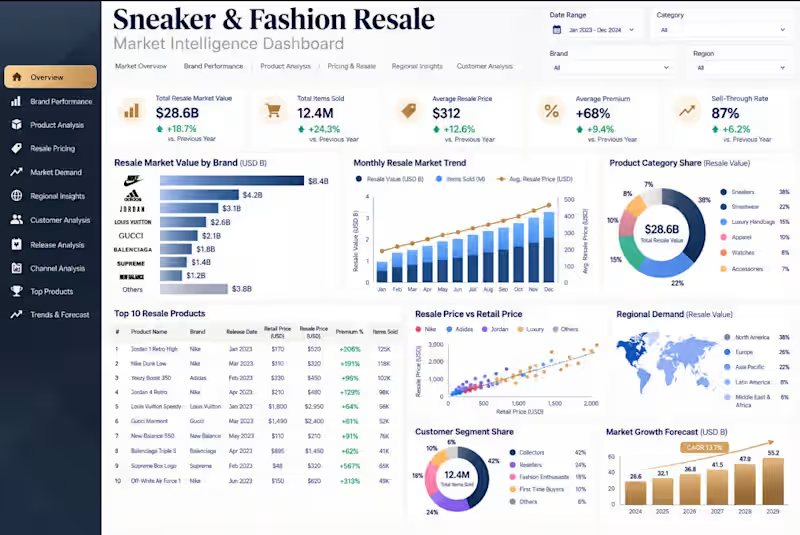
Sneaker & Fashion Resale
A premium Sneaker & Fashion Resale Intelligence Dashboard designed to analyze resale-market performance across sneakers, apparel, accessories, brands, regions, and sales channels.
The dashboard combines sales, resale prices, demand, inventory, margins, brand performance, and market trends into one executive view, helping businesses identify high-value products and profitable resale opportunities.
What It Helps With
• Resale Performance — Track revenue, units sold, average resale price, and profit margins.
• Brand Intelligence — Compare brand performance and identify high-demand brands.
• Product Analysis — Discover best-selling products and products with strong resale premiums.
• Demand Intelligence — Monitor demand trends and identify emerging products.
• Pricing Strategy — Analyze retail vs. resale prices and optimize pricing decisions.
• Inventory Management — Identify fast-moving and slow-moving inventory.
• Market Insights — Compare regional performance and sales-channel trends.
• Growth Strategy — Identify profitable categories and opportunities for market expansion.
Business Value: Helps resale marketplaces, fashion retailers, sneaker businesses, and investors make smarter decisions around pricing, inventory, sourcing, product selection, and revenue growth.
Client Note:
Developed to help resale businesses identify high-demand products, pricing opportunities, profitable releases, and changing consumer preferences. The dashboard provides a consolidated view of retail pricing, resale premiums, inventory, and market demand.
0
53

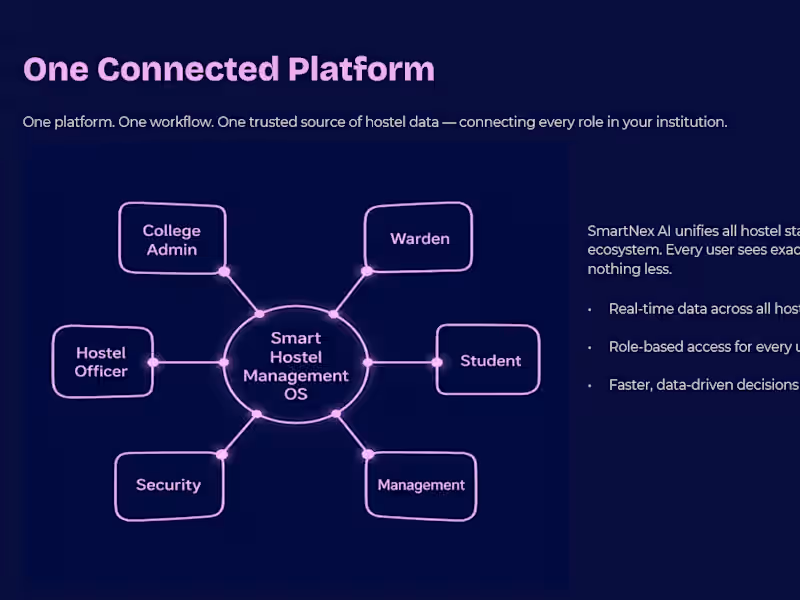
Founder at SmartNex AI | Full-Stack & AI Systems Engineer
New to Contra
Founder at SmartNex AI | Full-Stack & AI Systems Engineer
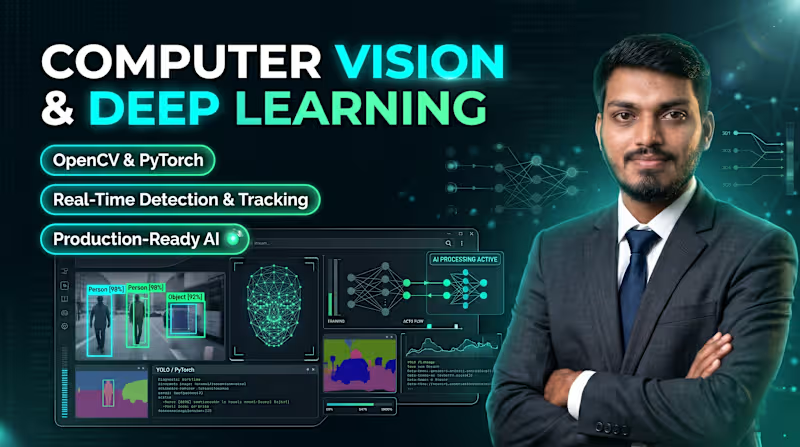
Engineered an ultra-low-latency computer vision pipeline achieving 99%+ accuracy in real-time object tracking and biometric facial recognition. Utilizes YOLOv8 and OpenCV optimized with ONNX runtime for sub-30ms inference on edge devices and live camera feeds.
0
6
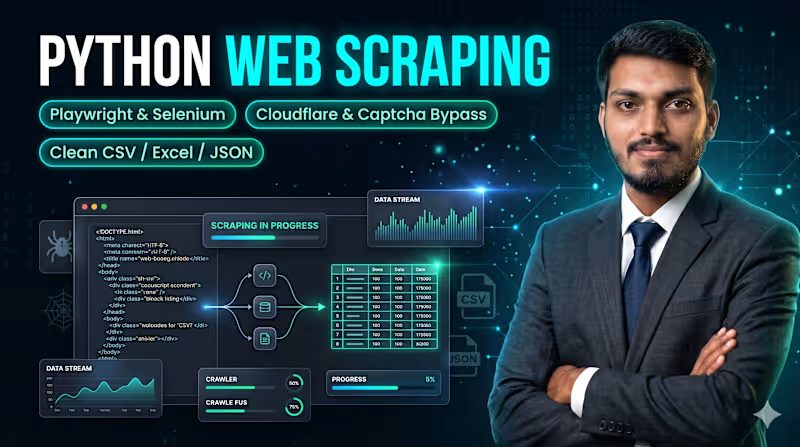
Built a high-concurrency automated data extraction pipeline processing 100,000+ records daily. Features automated Cloudflare bypass, rotating proxy management, dynamic JavaScript rendering (Playwright/Selenium), and automated data sanitization into PostgreSQL & clean JSON/CSV feeds.
0
9