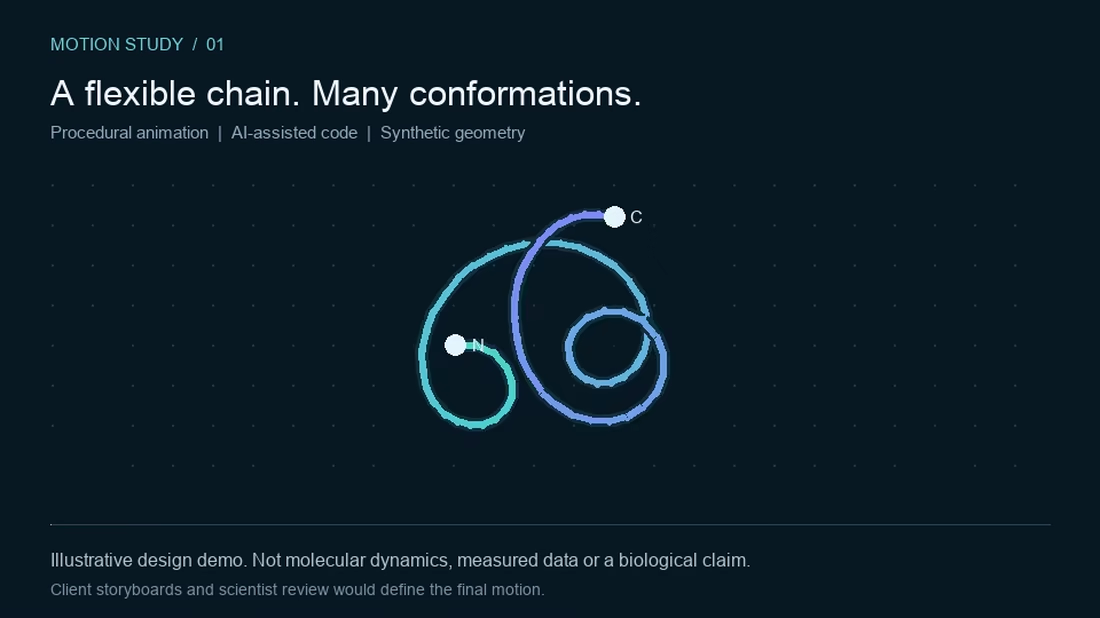
Procedural motion study: a flexible chain changing shape in a seamless loop. A self-initiated, AI-assisted Python animation with synthetic geometry and fixed segment lengths. This is a design/implementation demo, not molecular dynamics, measured protein data or a scientific result. Client references and scientist review would define any final biological animation. Rendered locally with existing tools; no paid generative-video subscription was used.
0
31

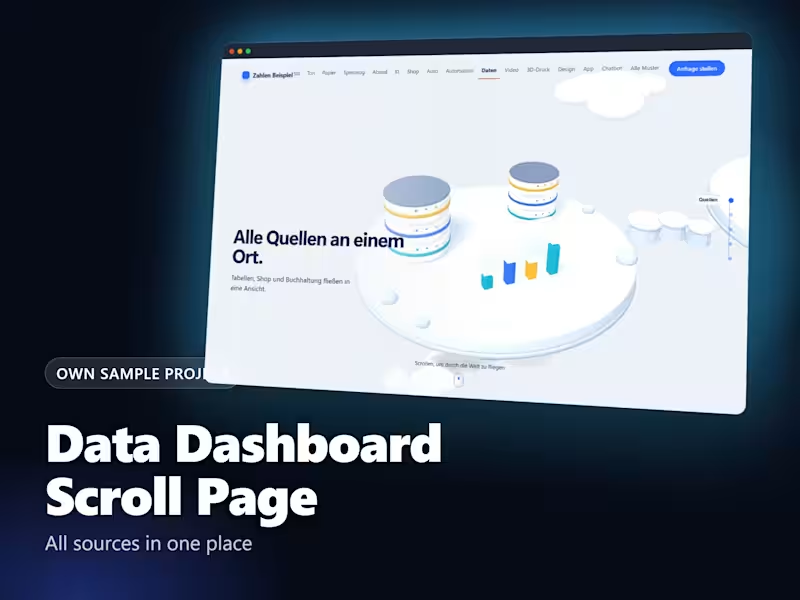
Data Dashboard Scroll Page (Own sample project)
Problem: numbers from tables, shop and bookkeeping live in different places. Solution: a scroll page that shows the idea of one view for all sources: database, bars, charts as a 3D scene. Own sample/demo project with sample data, not a client job. Three.js and plain HTML.
0
26
Power BI Executive KPI Dashboard Suite Industry: Business Services, Data Analytics Duration: 4 Months Project Cost: $7,500 Started On: March 2025 Created advanced Power BI dashboards and executive reporting solutions for real-time KPI tracking and strategic business analysis. The client required interactive dashboards for monitoring sales, operations, financial performance, and operational efficiency across multiple departments. I integrated multiple data sources, automated reporting pipelines, and designed visually optimized dashboards for executive management. Features included: • Interactive KPI dashboards • Automated data refresh • Advanced filtering and drill-down analytics • Executive-level reporting visuals • Performance monitoring metrics Technologies: Power BI, SQL Server, Azure SQL, PostgreSQL, Python
0
92
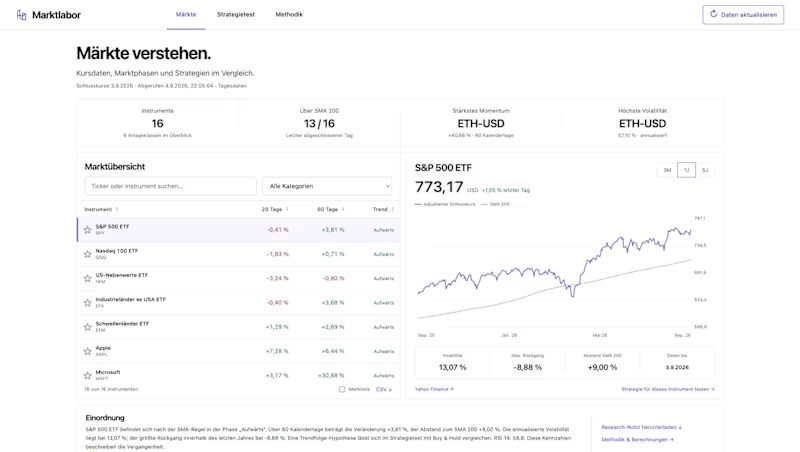
Marktlabor: a self-initiated market research dashboard built with AI assistance. Python prepares daily market data and a JavaScript interface provides instrument filters, watchlists, trend indicators, charts and CSV exports. This screenshot shows the working prototype using a dated historical snapshot. It demonstrates data tooling and interface implementation; it does not establish future investment returns or offer trading advice.
0
52

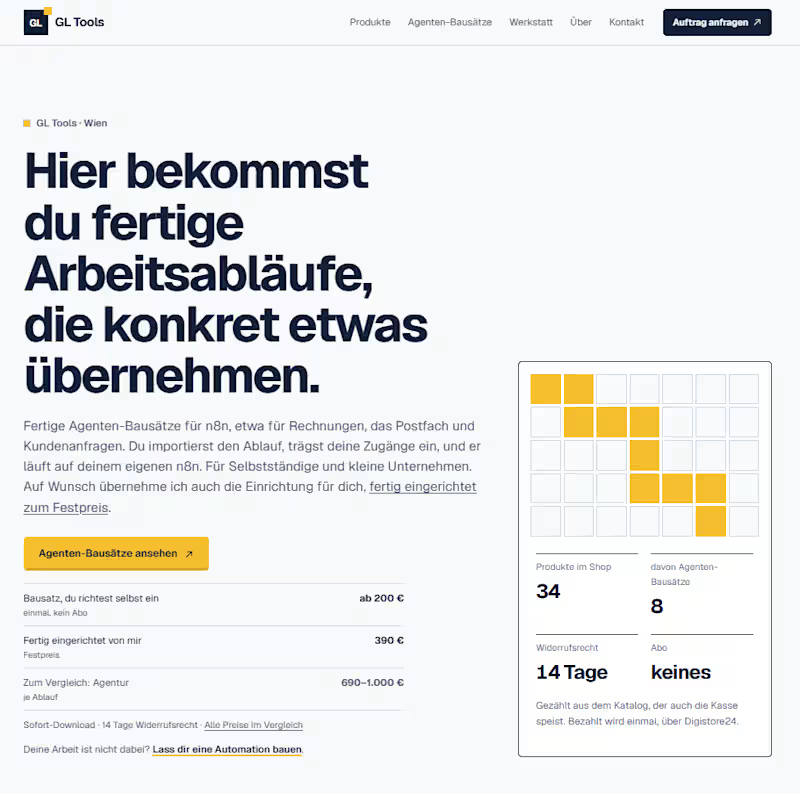
Welche Arbeit würdest du sofort abgeben, wenn sie automatisch laufen könnte?
E-Mails beantworten. Rechnungen erfassen. Bestellungen prüfen. Kundenanfragen sortieren. Daten übertragen.
Viele dieser Aufgaben wiederholen sich jeden Tag – obwohl sie sich automatisieren lassen.
Die GL Tools Automations-Werkstatt macht aus solchen Aufgaben einen fertigen digitalen Ablauf.
Du kannst einen bestehenden Agenten-Bausatz sofort nutzen oder uns deine eigene wiederkehrende Arbeit beschreiben. Wir prüfen den Ablauf und bauen daraus eine Automation, die genau diese Aufgabe übernimmt.
Du behältst die Kontrolle. Die Automation übernimmt die Routine.
fertige Bausätze ab Kauf verfügbar
echte Abläufe statt theoretischer Prompts
selbst einrichten oder fertig einrichten lassen
individuelle Automationen möglich
für Selbstständige und kleine Unternehmen Beschreib die Arbeit. Wir bauen den Ablauf.
0
81
Real-Time Kafka Streaming Analytics System
Industry: Technology, Software, Data Analytics Duration: 5 Months Project Cost: $9,500 Started On: June 2024 Developed a real-time event streaming and analytics platform for processing high-volume transactional data with minimal latency. The client needed a scalable architecture capable of handling live business events, processing streaming data in real time, and generating operational insights instantly. I designed a distributed Kafka-based event pipeline and developed Python consumers for processing and transforming incoming data streams. The system included fault-tolerant stream processing, automated monitoring, Docker-based deployment pipelines, and scalable microservices architecture orchestrated through Kubernetes. Key achievements: • Built a scalable event-driven architecture • Enabled real-time analytics and monitoring • Improved system reliability and fault tolerance • Reduced latency in data processing operations Technologies: Apache Kafka, Python, Docker, Kubernetes, PostgreSQL, GitLab CI/CD
0
96
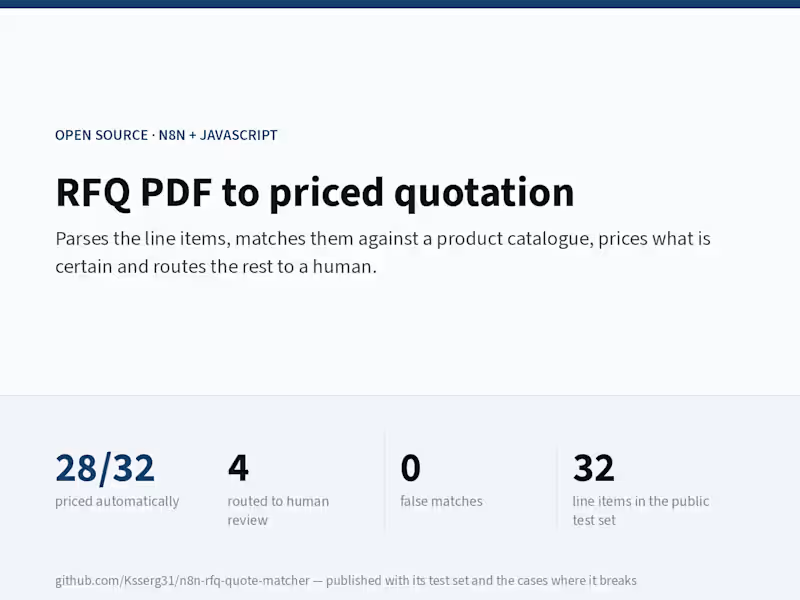
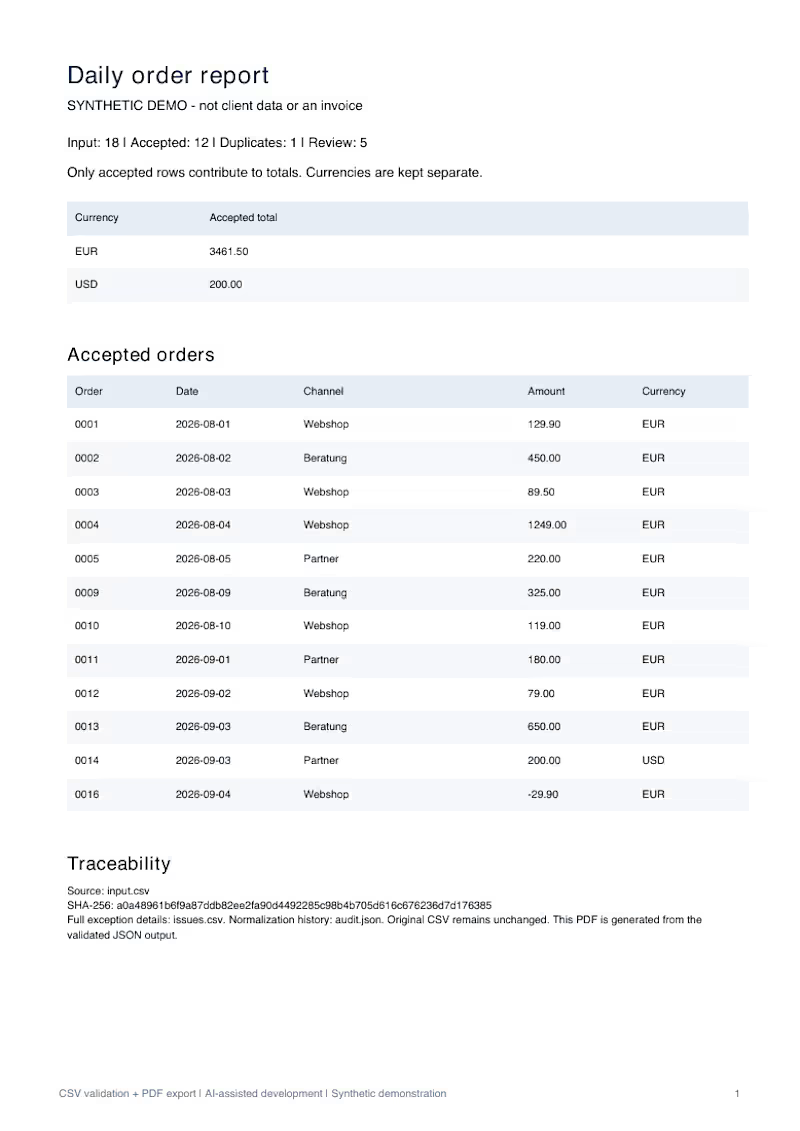
CSV-to-PDF reporting extension. This working Python/ReportLab component turns validated records into a readable PDF with separate currency totals, a row-level table and source traceability. Existing output files are protected from overwriting. Part of the same CSV workflow demo shown in this portfolio, built with AI assistance and tested using synthetic records. The image shows the generated PDF, not a client document.
0
50

Enterprise ETL & Data Warehouse Platform
Designed and developed a scalable enterprise ETL and data warehousing platform for consolidating large volumes of structured and semi-structured business data into a centralized analytics ecosystem. The client required a high-performance reporting infrastructure capable of integrating data from multiple operational systems while improving reporting speed, data quality, and business visibility. I designed automated ETL workflows using Python and Apache Airflow, implemented optimized relational database models, and developed Power BI dashboards for executive-level KPI monitoring. Major responsibilities included database schema design, SQL performance optimization, API integrations, incremental data loading strategies, data transformation workflows, and automated reporting pipelines. One of the main challenges involved handling inconsistent legacy data structures and improving performance for high-volume analytics queries. I solved this by redesigning indexing strategies, implementing partitioning techniques, and optimizing query execution plans. Results: • Reduced reporting time by more than 70% • Improved data consistency across departments • Automated manual reporting workflows • Increased scalability and maintainability of the data platform
0
107
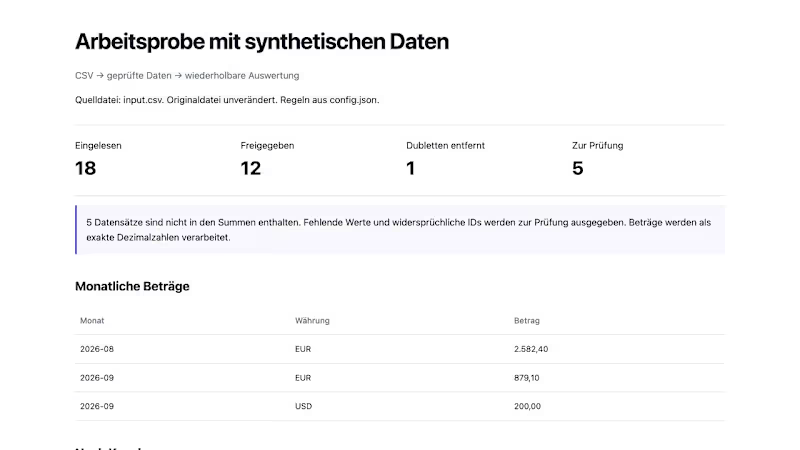
CSV validation and reporting: a working Python demo that separates accepted rows, duplicates and exceptions, preserves source files, and creates an auditable HTML report. This self-initiated, AI-assisted sample uses synthetic data, not client records. Demo result: 18 input rows, 12 accepted, 1 duplicate and 5 rows flagged for review. Currency totals are kept separate.
0
48