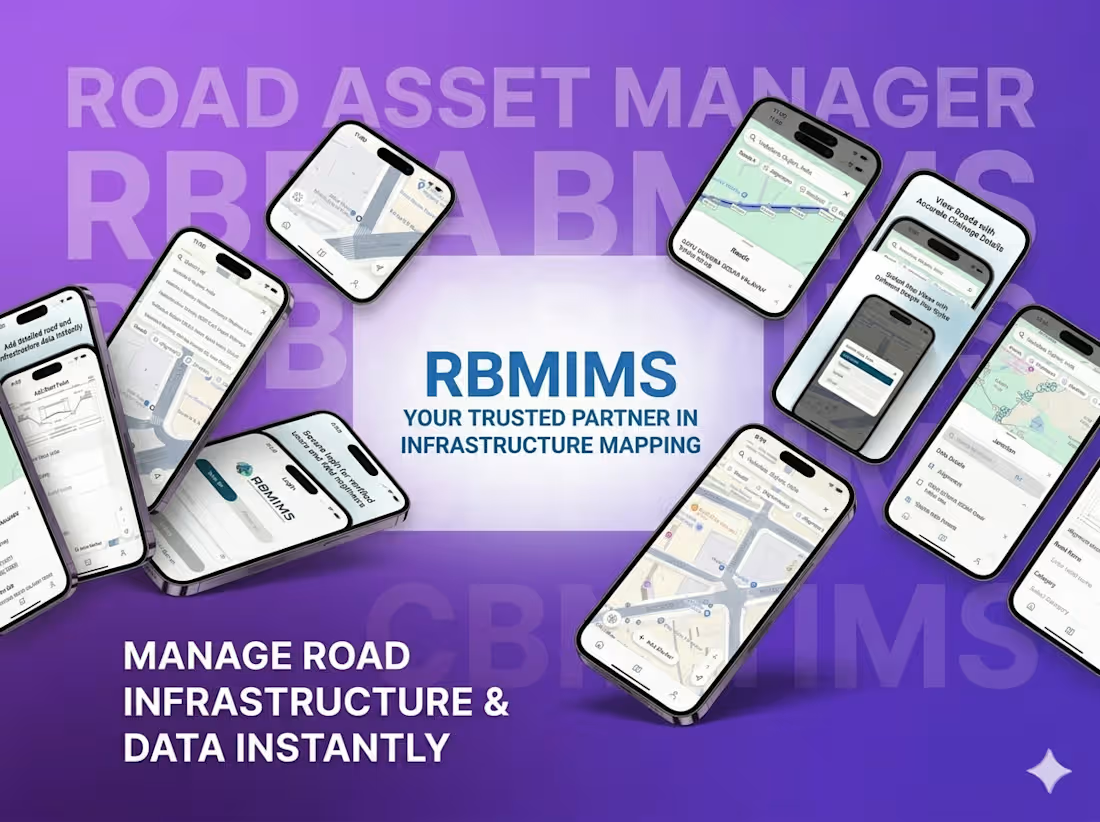
RBMIMS : (Geo Mapping)
◆ Context & Challenge
The client aimed to digitize and streamline road infrastructure data collection and management for government departments, engineers, and field surveyors.
The challenge was to:
‣ Replace manual and fragmented data collection processes
‣ Enable accurate, real-time geospatial data capture from field locations
‣ Ensure usability for on-ground teams working in diverse conditions
‣ Provide a centralized system for monitoring, validation, and approvals
◆ Approach & Solution
We developed RBMIMS (Road Building Mapping Information Management System), an intelligent geospatial platform designed to digitize infrastructure mapping and streamline field operations.
The solution leverages mobile-based data capture, GPS tracking, and structured workflows to enable efficient infrastructure monitoring and management.
◆ Key focus areas:
‣ Geospatial data collection and mapping
‣ Real-time GPS-based tracking and field data capture
‣ Structured workflows for infrastructure management
‣ Offline functionality for remote field usage
‣ Centralized system for monitoring and approvals
◆ Execution
‣ Designed and developed a mobile-first geospatial application for field teams
‣ Built backend systems for real-time data synchronization and storage
‣ Implemented GPS-based mapping and structured data collection forms
‣ Developed offline capabilities for uninterrupted field operations
‣ Created dashboards for centralized monitoring and approval workflows
◆ Outcome & Impact
RBMIMS transforms traditional infrastructure data collection into a digital, efficient, and scalable system.
‣ Improved accuracy and reliability of field data
‣ Reduced manual effort and data inconsistencies
‣ Enhanced visibility into infrastructure development processes
‣ Faster approvals and streamlined operational workflows
‣ Scalable solution for large-scale government deployment
0
71


🧠 Title: Statistical Analysis of 325 Survey Responses for Research Study
📌 Problem: The client required a complete statistical analysis of survey data (325 respondents) to examine relationships between multiple factors such as organizational support, job involvement, and employee engagement.
They needed:
1. Correct statistical test selection
2. Accurate analysis
3. Clear interpretation for research reporting
⚙️ Approach: I followed a structured analytical process:
1. Data cleaning and preprocessing
2. Reliability testing (Cronbach’s Alpha)
3. Descriptive statistics
4. Correlation analysis
5. Regression analysis
6. Hypothesis testing using SPSS
🛠 Tools Used: SPSS, Excel, R, Python
📊 Results
1. Identified significant relationships between key variables
2. Established impact of organizational support on engagement
3. Generated clear statistical outputs with interpretation
🎯 Outcome: The client successfully completed their research project with strong statistical backing and well-structured results for their report/dissertation.
💡 Key Value Delivered
1. Accurate and reliable statistical analysis
2. Easy-to-understand interpretation
3. Research-ready outputs
0
105
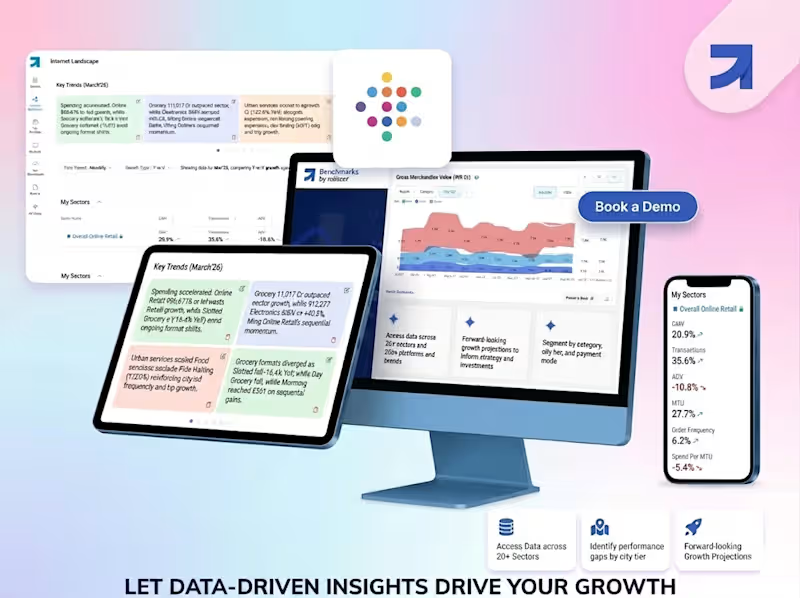
BenchMark
◆ Context & Challenge
The client needed a modern and scalable digital platform to showcase services, support marketing campaigns, and improve client engagement. The challenge was to combine high-performance web development with UX-driven design and integrated marketing tools, while enabling businesses to track performance and optimize their digital presence effectively
◆ Approach & Solution
We developed a user-centric digital platform that integrates design, content, and marketing capabilities, enabling businesses to manage their online presence and drive data-driven growth.
◆ Key focus areas:
‣ User-centric UI/UX for improved engagement
‣ SEO and performance marketing integration
‣ Content-driven architecture for scalability
‣ Analytics and conversion tracking systems
‣ Secure and high-performance infrastructure
◆ Execution
‣ Built responsive and scalable web platform
‣ Implemented SEO and content management capabilities
‣ Integrated analytics tools for user behavior tracking
‣ Developed UX testing and usability optimization workflows
‣ Designed secure hosting and performance-focused architecture
◆ Outcome & Impact
The platform enables businesses to enhance their digital presence and optimize marketing performance.
‣ Improved user engagement through optimized UX design
‣ Increased visibility with integrated SEO strategies
‣ Data-driven decision making with analytics insights
‣ Enhanced conversion rates through performance optimization
‣ Scalable foundation for ongoing digital growth
0
81
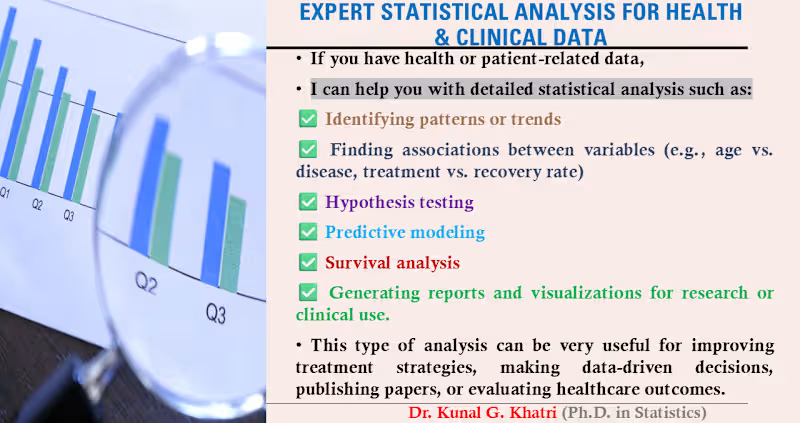
🚀 Available for Statistical Analysis & Research Projects
I’m a PhD-qualified Statistician with 14+ years of experience in data analysis and academic research.
I help clients with:
• Survey data analysis (SPSS, R, Python)
• Hypothesis testing, regression, factor analysis
• Thesis, dissertation & research support
• Data visualization & interpretation
I focus on delivering accurate results, clear insights, and professional reports.
📍 Time Zone: IST (UTC +5:30)
🌍 Available for global clients
If you’re working on a research or data-driven project, feel free to connect!
0
51

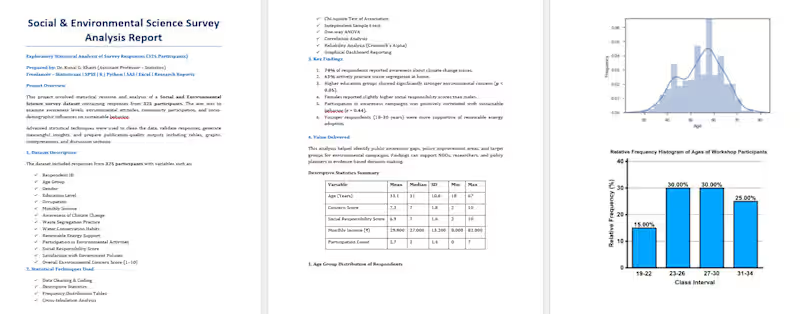
This project involved statistical revision and analysis of a Social and Environmental Science survey dataset containing responses from 325 participants. The aim was to examine awareness levels, environmental attitudes, community participation, and socio-demographic influences on sustainable behavior.
Advanced statistical techniques were used to clean the data, validate responses, generate meaningful insights, and prepare publication-quality outputs including tables, graphs, interpretations, and discussion sections.
0
42