Data Science Projects in Nairobi CountyData Science Projects in Nairobi CountyExecutive Summary – Critical Minerals Supply Concentration Analysis
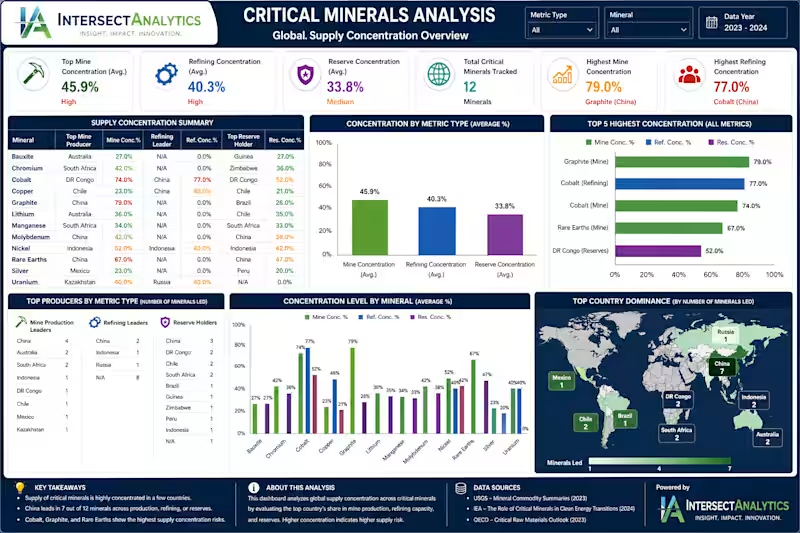
This dashboard provides a comprehensive global analysis of critical minerals, highlighting the growing risks associated with supply concentration across mining, refining, and reserves. As demand accelerates due to the global energy transition, the data reveals a heavy reliance on a small number of countries, creating significant geopolitical and supply chain vulnerabilities.
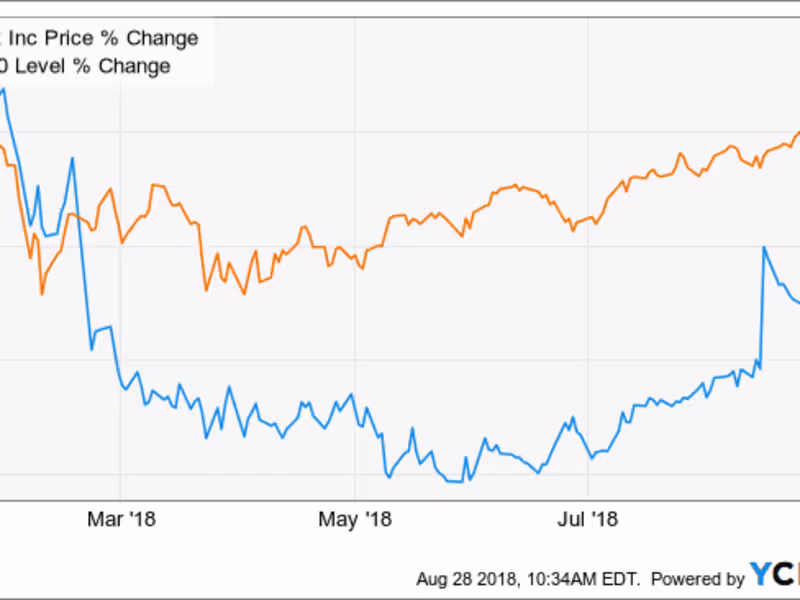
The analysis shows that average mine concentration stands at ~45.9%, with refining concentration even higher at ~40.3%, indicating that production and processing are highly centralized. Minerals such as graphite (79%), cobalt (74%), and rare earths (67%) exhibit particularly high concentration levels, signaling elevated supply risk.
A key insight is the dominance of China, which leads in multiple areas including refining and reserves, making it the most influential player in the global minerals supply chain. Other critical contributors include DR Congo (cobalt) and Indonesia (nickel), further emphasizing the limited geographic diversification of supply.
📊 Key Insights
High Supply Risk Minerals: Cobalt, Graphite, and Rare Earths show the highest concentration levels
Refining Bottleneck: China dominates global refining capacity, especially for cobalt and copper
Geographic Dependence: A few countries control the majority of global supply chains
Moderate Risk Minerals: Nickel, Lithium, and Chromium show growing but manageable concentration levels
Lower Risk Minerals: Bauxite, Silver, and Manganese exhibit relatively lower concentration risk
🎯 Strategic Implications
This analysis highlights a critical challenge in the global transition to clean energy:
👉 Supply security is as important as resource availability.
Without diversification of supply chains and investment in alternative sources, industries remain exposed to price volatility, geopolitical risks, and supply disruptions.
💼 Powered by Intersect Analytics
At Intersect Analytics, we transform complex global datasets into clear, decision-ready insights. This dashboard reflects our expertise in combining data analytics, visualization, and strategic thinking to help organizations understand risks and act with confidence.
⭐ The Bottom Line
This is more than just a dashboard—it’s a strategic lens into the future of global resource security.
👉 With Intersect Analytics, you gain the clarity needed to navigate risk, identify opportunities, and stay ahead in a rapidly evolving global economy.