Freelance Product Data Analysts in Nairobi
Freelance Product Data Analysts in Nairobi
Sign Up
Post a job
Sign Up
Log In
Filters
2
Projects
People
Johnson Wairimu
Nairobi, Kenya
Delivering Strategic Growth Through Data, Finance & Tech.
7
Followers
Follow
Message
Delivering Strategic Growth Through Data, Finance & Tech.
0
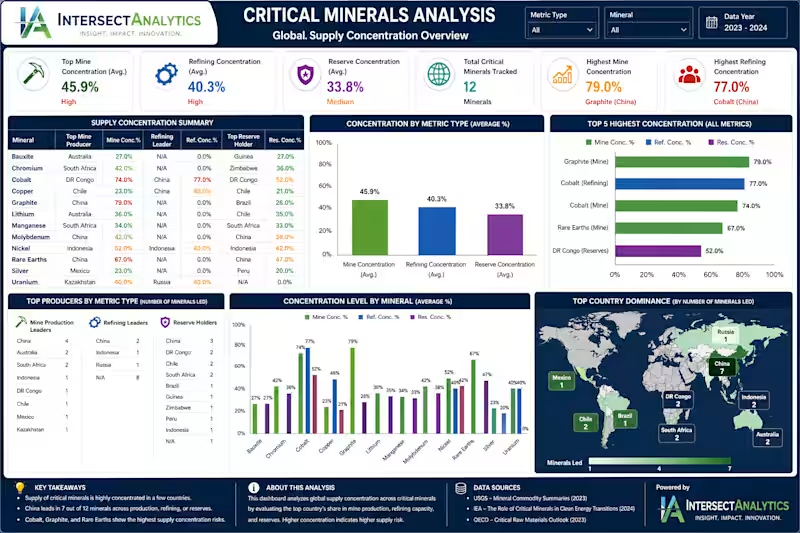
Executive Summary – Critical Minerals Supply Concentration Analysis This dashboard provides a comprehensive global analysis of critical minerals, highlighting the growing risks associated with supply concentration across mining, refining, and reserves. As demand accelerates due to the global energy transition, the data reveals a heavy reliance on a small number of countries, creating significant geopolitical and supply chain vulnerabilities. The analysis shows that average mine concentration stands at ~45.9%, with refining concentration even higher at ~40.3%, indicating that production and processing are highly centralized. Minerals such as graphite (79%), cobalt (74%), and rare earths (67%) exhibit particularly high concentration levels, signaling elevated supply risk. A key insight is the dominance of China, which leads in multiple areas including refining and reserves, making it the most influential player in the global minerals supply chain. Other critical contributors include DR Congo (cobalt) and Indonesia (nickel), further emphasizing the limited geographic diversification of supply. 📊 Key Insights High Supply Risk Minerals: Cobalt, Graphite, and Rare Earths show the highest concentration levels Refining Bottleneck: China dominates global refining capacity, especially for cobalt and copper Geographic Dependence: A few countries control the majority of global supply chains Moderate Risk Minerals: Nickel, Lithium, and Chromium show growing but manageable concentration levels Lower Risk Minerals: Bauxite, Silver, and Manganese exhibit relatively lower concentration risk 🎯 Strategic Implications This analysis highlights a critical challenge in the global transition to clean energy: 👉 Supply security is as important as resource availability. Without diversification of supply chains and investment in alternative sources, industries remain exposed to price volatility, geopolitical risks, and supply disruptions. 💼 Powered by Intersect Analytics At Intersect Analytics, we transform complex global datasets into clear, decision-ready insights. This dashboard reflects our expertise in combining data analytics, visualization, and strategic thinking to help organizations understand risks and act with confidence. ⭐ The Bottom Line This is more than just a dashboard—it’s a strategic lens into the future of global resource security. 👉 With Intersect Analytics, you gain the clarity needed to navigate risk, identify opportunities, and stay ahead in a rapidly evolving global economy.
0
21
0
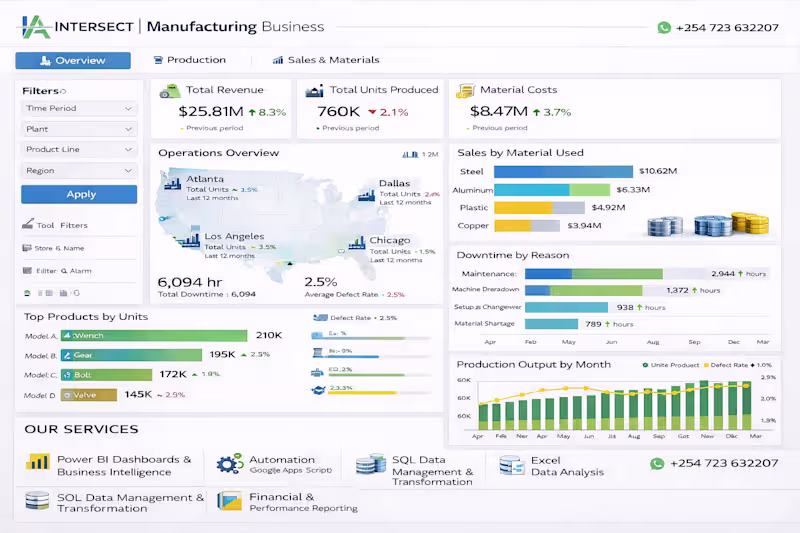
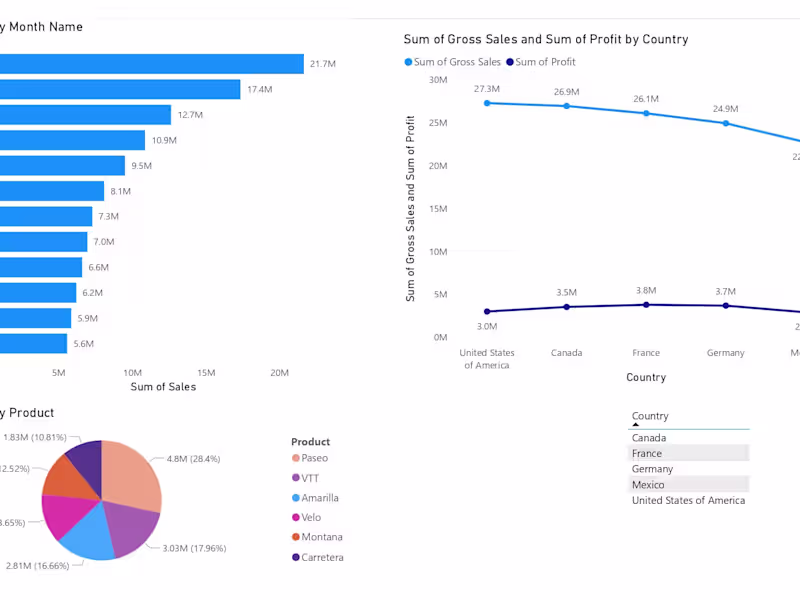
🚀 Manufacturing Intelligence Dashboard | Powered by Intersect Analytics What if you could track your entire manufacturing operation—from production to material usage—in one powerful, real-time dashboard? We recently developed this advanced Power BI Manufacturing Dashboard designed to give businesses full visibility into operations, costs, and performance. 📊 Key Insights from the Dashboard 🔹 Revenue Growth: Total revenue reached $25.81M, showing a strong upward trend 🔹 Production Performance: Over 760K units produced, highlighting operational scale 🔹 Material Cost Optimization: Steel and Aluminum drive the highest costs—key areas for cost control 🔹 Top Products: Wrench and Gear lead in production volume, indicating high demand 🔹 Operational Efficiency: • On-time delivery rate at 94.5% • Downtime largely driven by maintenance and machine breakdowns 🔹 Production Trends: Consistent monthly growth with opportunities to reduce defect rates 🛠️ Our Core Services At Intersect Analytics, we deliver more than dashboards: • Power BI Dashboards & Business Intelligence • Data Cleaning, Transformation & Modeling • Automation (Excel, Python, Google Apps Script) • SQL Data Management & Optimization • Financial & Operational Reporting • Advanced Data Analysis & Forecasting 🎯 Why Choose Intersect Analytics? ✔ We fix your data first—no garbage insights ✔ We build end-to-end solutions (data → insights → action) ✔ We combine business + technical expertise ✔ We design dashboards that are clear, interactive, and decision-focused ✔ We help you reduce costs, improve efficiency, and grow revenue 📈 Business Impact 🚀 Improve production efficiency 📉 Reduce downtime and operational losses 💰 Optimize material costs 📊 Make faster, data-driven decisions 📩 Ready to transform your manufacturing data? 📞 +254 723 632207 (WhatsApp Available) 💡 Intersect Analytics — Turning operational data into business performance.
0
28
0
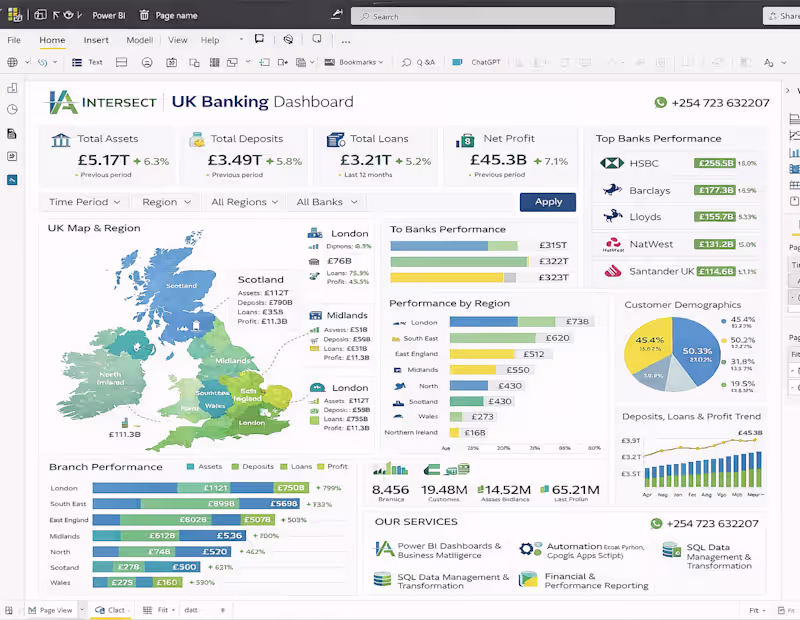
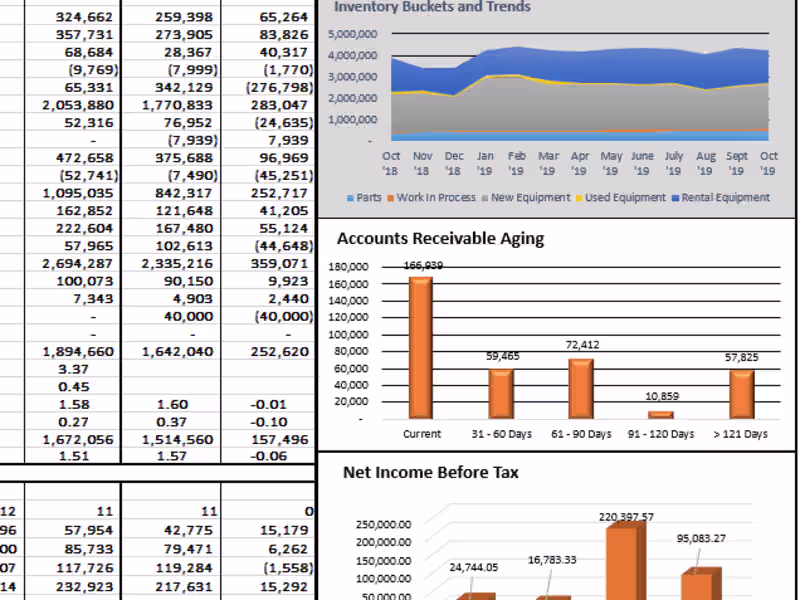
🚀 UK Banking Dashboard | Advanced Financial Analytics by Intersect Analytics Unlock the full potential of your financial data with our Power BI–driven UK Banking Dashboard, designed to deliver real-time insights, performance tracking, and data-driven decision-making for financial institutions and analysts. 📊 Comprehensive Banking Performance Insights Our dashboard provides a 360° view of the UK financial sector, covering: ✔ Total Assets, Deposits, Loans & Profitability ✔ Top Bank Performance (HSBC, Barclays, Lloyds, NatWest, Santander) ✔ Regional Performance Analysis (London, Midlands, Scotland & more) ✔ Customer Demographics & Behavior Insights ✔ Branch-Level Performance Tracking ✔ Trends in Deposits, Loans & Profit Growth With interactive filters (Time Period, Region, Bank), users can drill down into specific insights instantly. ⚙️ Built with Industry-Leading Tools This solution is powered by: 📊 Power BI – Interactive dashboards & advanced visual analytics 🗄️ SQL – Data extraction, transformation & modeling 🐍 Python – Automation & advanced data processing 📈 Excel – Financial modeling & reporting 💼 Our Core Services At Intersect Analytics, we deliver end-to-end data solutions: 🔹 Business Intelligence Dashboards (Power BI & Tableau) 🔹 Data Cleaning, Transformation & Modeling 🔹 Automation (Excel, Python, Google Apps Script) 🔹 SQL Database Management & Optimization 🔹 Financial & Operational Reporting 🎯 Why Choose Intersect Analytics? ✔ Data-first approach – Clean, structured, and reliable data foundation ✔ Custom-built solutions – Tailored to your business needs ✔ Advanced analytics expertise – Finance + Data combined ✔ Actionable insights – Not just dashboards, but real business value ✔ Professional, scalable delivery 📈 Business Impact 🚀 Improve financial visibility and reporting accuracy 📊 Make faster, data-driven decisions 💰 Identify growth opportunities and optimize profitability 🔍 Gain deeper insights into customers and regional performance 📩 Get Started Today Ready to transform your financial data into powerful insights? 📞 +254 723 632207 (WhatsApp Available) 📍 Intersect Analytics 💡 Intersect Analytics — Turning complex data into clear financial intelligence.
0
28
0
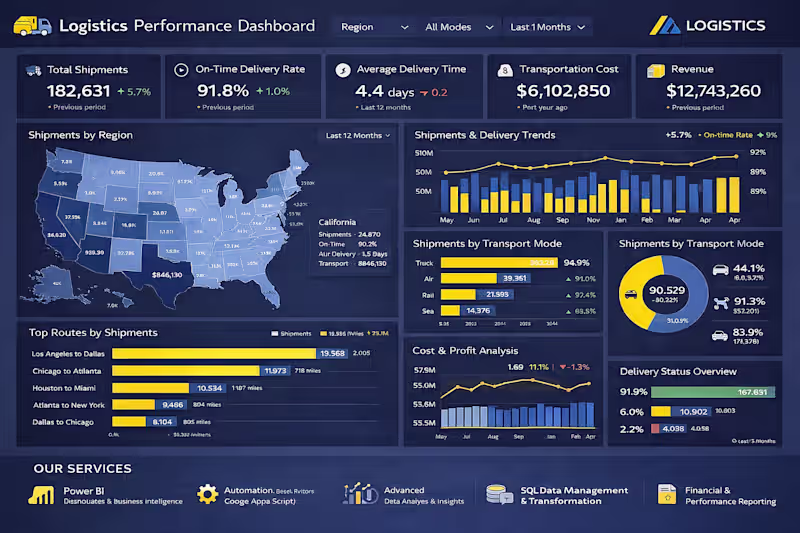
🚛 Transform Your Logistics Data into Actionable Insights Still relying on spreadsheets and manual reports to track your operations? It’s time to upgrade to smart, real-time analytics. At Intersect Analytics, we help logistics and operations teams gain full visibility into their performance with powerful, interactive dashboards. 📊 What You Get ✔ Real-time tracking of shipments, delivery performance & costs ✔ Clear insights on top routes, regions & transport modes ✔ Monitoring of on-time delivery and operational efficiency ✔ Data-driven decisions that improve profitability & performance 🛠️ Our Core Services 📊 Power BI Dashboards & Business Intelligence ⚙️ Automation (Excel, Python, Google Apps Script) 🗄️ SQL Data Management & Transformation 🧠 Advanced Data Analysis & Insights 📈 Financial & Operational Reporting 🎯 Why Choose Intersect Analytics? ✔ We clean and structure your data first (no “garbage in, garbage out”) ✔ We deliver end-to-end solutions—from raw data to insights ✔ We build custom dashboards tailored to your business ✔ We focus on results, not just visuals 💡 The Result 🚀 Faster decision-making 📉 Reduced operational inefficiencies 📈 Improved delivery performance 💰 Better cost control and profitability 📩 Ready to take control of your logistics performance? 📞 +254 723 632207 (WhatsApp Available) 💡 Intersect Analytics — Turning data into decisions.
0
31
Product Data Analyst
(4)
Follow
Message
Faith Kinyoo
Nairobi, Kenya
Data Insights with Precision & Care
Follow
Message
Data Insights with Precision & Care
0
Dashboard creation
0
6
0
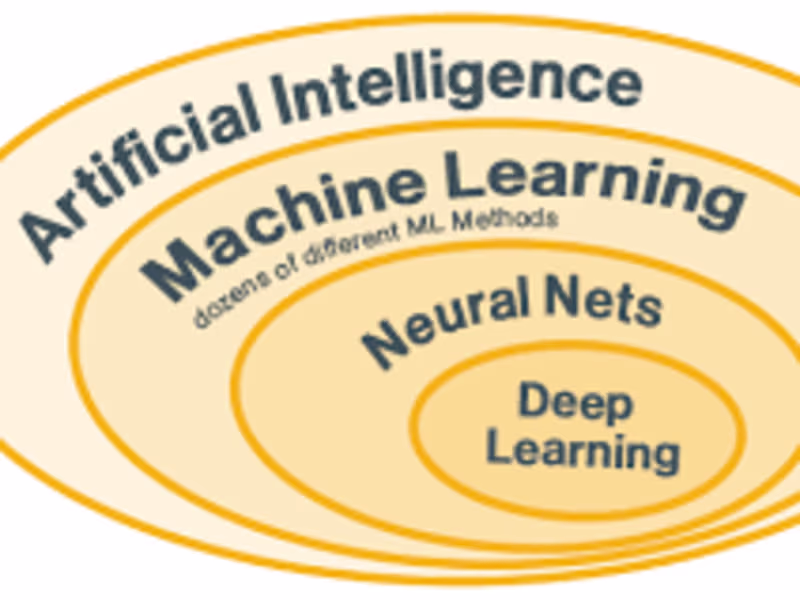
AI Model Training
0
2
0
Faith Kinyoo
0
4
View more →
Product Data Analyst
(1)
Follow
Message
Explore people