
Apple’s Performance Is Not Built on Products Alone. It Is Built on Systems, Diversification, and Intelligent Decisions.
At Intersect Analytics, we scraped, transformed, and analyzed Apple Inc.’s sales and financial performance data using Python and Power BI to understand what drives one of the world’s most valuable companies.
The findings reveal an important lesson for every business:
Growth becomes sustainable when performance is measurable.
Key Findings From Apple’s Performance Analysis
📱 iPhone Continues Leading Revenue Generation
Apple’s iPhone business remains the company’s strongest revenue engine, demonstrating the importance of maintaining a strong core product while continuously innovating.
☁️ Services Revenue Continues Growing Rapidly
Subscription services, cloud ecosystems, and recurring revenue streams continue strengthening profitability and long-term business resilience.
🌍 Regional Diversification Reduces Risk
Apple’s strong performance across multiple global markets highlights the value of diversification in protecting businesses from overreliance on one market or customer segment.
📈 Strong Margins Reflect Operational Discipline
Sustained profitability demonstrates the importance of operational efficiency, cost management, and strategic investment.
📊 Performance Visibility Drives Better Decisions
Apple’s ability to track performance across products, regions, and financial metrics reinforces a simple reality:
What gets measured gets improved.
How We Built the Analysis
🐍 Python for Data Scraping & Transformation
📊 Power BI for Interactive Dashboard Development
📈 Business Performance & Financial Analytics
⚙️ Automated Reporting & KPI Monitoring
What This Means for Businesses
Most businesses are sitting on valuable data but spend too much time:
❌ Updating spreadsheets manually
❌ Preparing repetitive reports
❌ Chasing numbers across systems
❌ Making decisions with incomplete information
At Intersect Analytics, we help businesses turn raw data into automated dashboards, smarter reporting systems, and faster decision-making tools.
Our Services
✔ Power BI Dashboards & Business Intelligence
✔ Excel & Google Sheets Automation
✔ Python Data Analysis & Automation
✔ Financial Analysis & KPI Reporting
✔ SQL & Database Analytics
✔ Workflow Automation & Reporting Systems
Because successful businesses are not built by working harder alone.
They grow by building systems that save time, improve decisions, and scale performance.
INTERSECT ANALYTICS
Power BI | Automation | Financial Analysis | Business Intelligence
Decisions Backed by Data. Growth Driven by Insight.
📞 +254 723 632 207
1
57
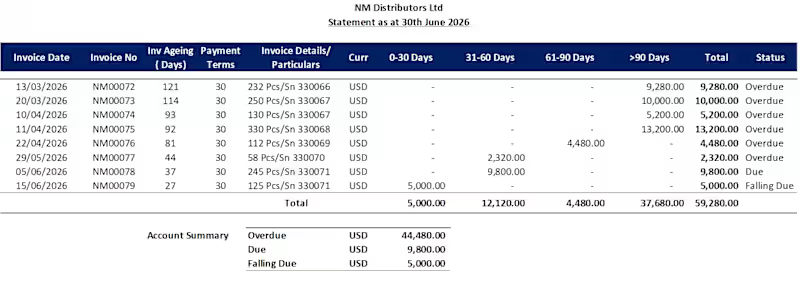
This project involved preparing a comprehensive customer aged statement to provide a clear overview of outstanding accounts receivable. The report categorized unpaid invoices by aging periods, helping the client identify overdue balances, prioritize collections, monitor customer payment behavior, and improve cash flow management through accurate and timely reporting.
0
54


Developed an investor-ready proposal for a youth
wealth-creation initiative targeting 100+ young people in Kajiado County Kenya. Included full ROI modelling, phased pilot launch plan, political positioning strategy, and social impact framework. Written to attract both government and private investment. The proposal included a 2 minute video.
0
59
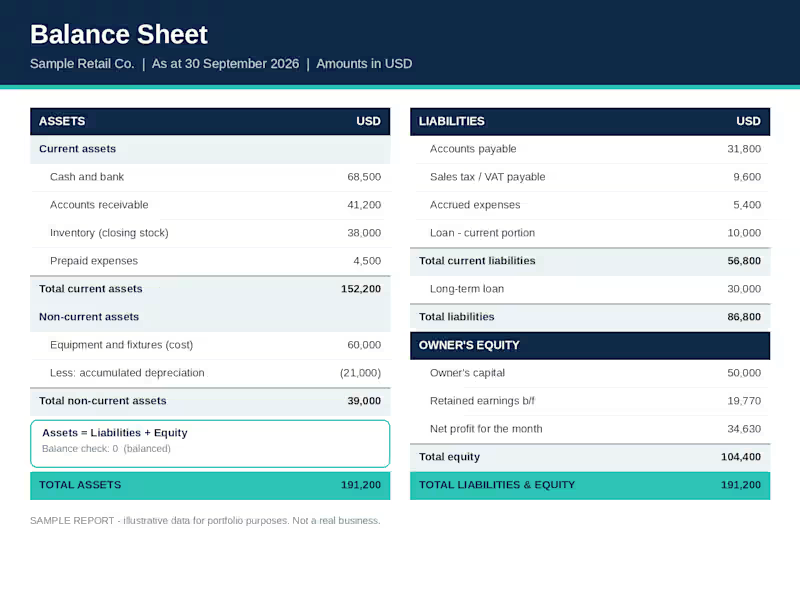
I prepare clear, accurate Balance Sheets that show business owners exactly what their business owns, what it owes, and what it is worth at the end of each month.This sample presents assets (current and non-current), liabilities (current and long-term) and owner's equity side by side, with net profit carried over from the monthly P&L. A built-in balance check confirms that assets equal liabilities plus equity.
What you get when we work together:
A clean, easy-to-read Balance Sheet every month, even if you're not an accountant
Figures that reconcile with your P&L and cash records
Accurate reports prepared in QuickBooks and Excel
Need monthly bookkeeping and financial reporting for your business? Send me a message and let's talk.
0
16