AI Integration & Automation Engineer | Full-Stack Web Apps
AI Integration & Automation Engineer | Full-Stack Web Apps


Full Stack Developer | AI & Automation
AI Automation Expert
AI Automation Expert


AI & Automation Specialist | Building Custom Chatbots & Agen
AI & Automation Specialist | Building Custom Chatbots & Agen
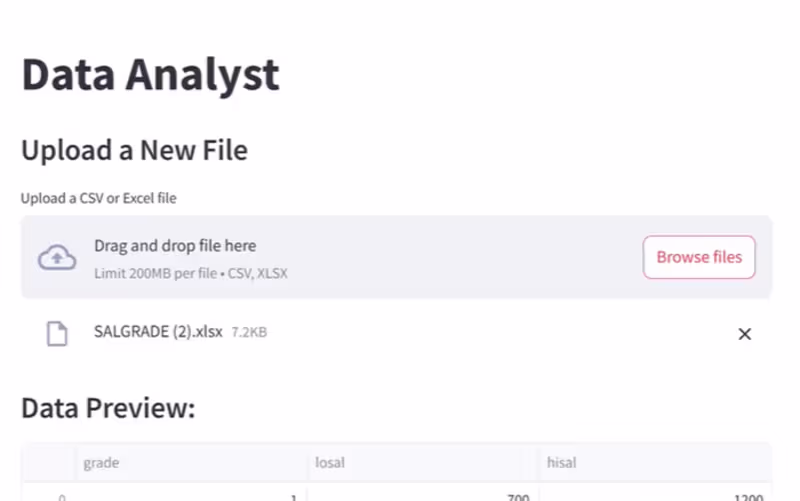
Data Scientist: Expert in Analysis, Databases, AI🔍
Data Scientist: Expert in Analysis, Databases, AI🔍

Fullstack AI Builder | Automating Business Pipelines
- $1k+
- Earned
- 1x
- Hired
- 5.0
- Rating
- 2
- Followers
Fullstack AI Builder | Automating Business Pipelines
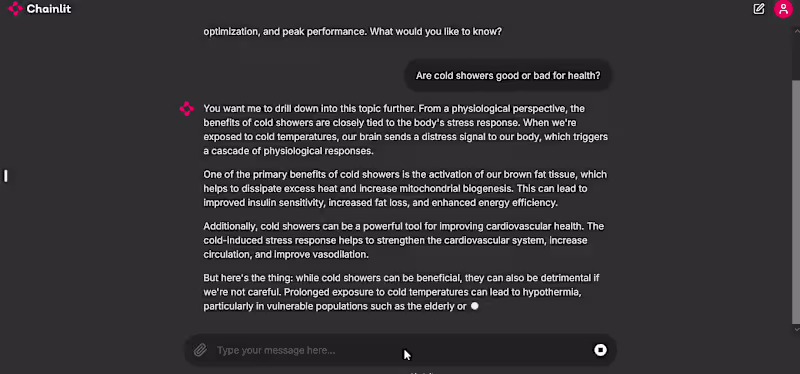
I am a Python and AI developer building smart solutions pro.
New to Contra
I am a Python and AI developer building smart solutions pro.

Generative AI/NLP Developer/Engineer
Generative AI/NLP Developer/Engineer