Financial Analysis Projects in KhushābFinancial Analysis Projects in KhushābFinance Management Dashboard
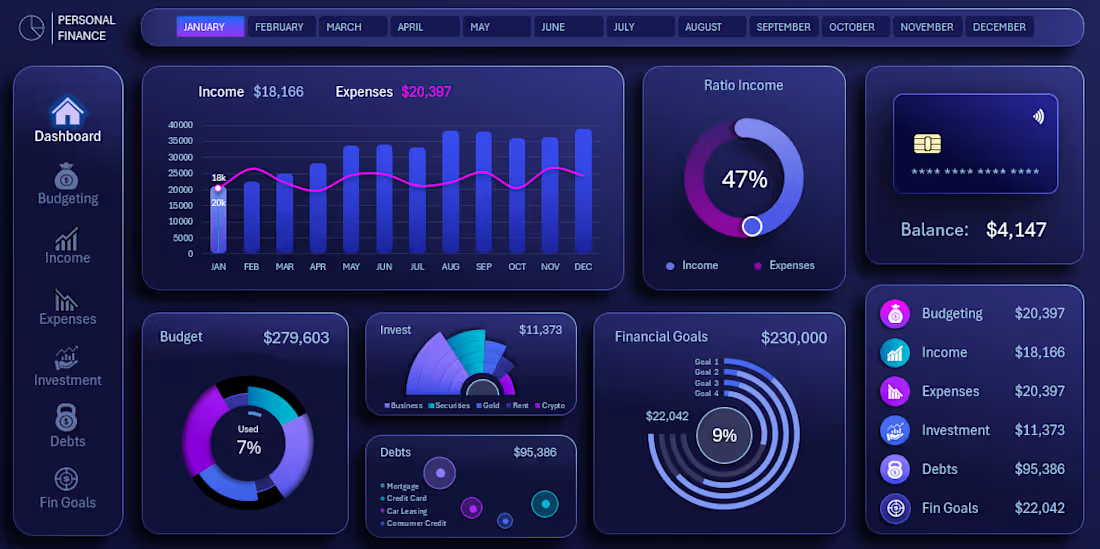
Designed a professional Finance Management Dashboard in Microsoft Excel to provide a clear overview of a business's financial performance, cash position, income, expenses, profitability, and outstanding balances.
The dashboard brings important financial information into one organized interface, making it easier to monitor business performance and review financial data without working through multiple separate spreadsheets.
Key Features
Financial KPI Dashboard: Revenue, expenses, gross profit, net profit/loss, accounts receivable, and accounts payable.
Income Management: Track income by source, category, amount, tax, payment method, account, and date.
Expense Management: Organize operating, administrative, payroll, tax, capital, and miscellaneous expenses.
Cash Flow Monitoring: Track money coming in and going out across business accounts.
Customer/Client Ledger: Maintain transaction history, payments, running balances, and outstanding amounts.
Supplier/Vendor Ledger: Track purchases, payments, balances, and amounts owed to suppliers.
Bank & Cash Management: Monitor account balances, transfers, deposits, withdrawals, and reconciliation.
Budget Tracking: Compare actual financial performance against planned budgets and identify variances.
Profit & Loss Analysis: Review revenue, costs, expenses, gross profit, operating profit, and net profit.
Financial Reporting: Structured financial reports for reviewing business performance over different periods.
Data Visualization: Charts and visual summaries for sales, revenue, expenses, profit, and cash flow trends.
Date-Based Analysis: Review financial performance by different time periods and compare historical results.
Project Focus
Finance Management • Business Analytics • Financial Dashboard • Excel Dashboard • Data Management • Financial Reporting • Business Operations