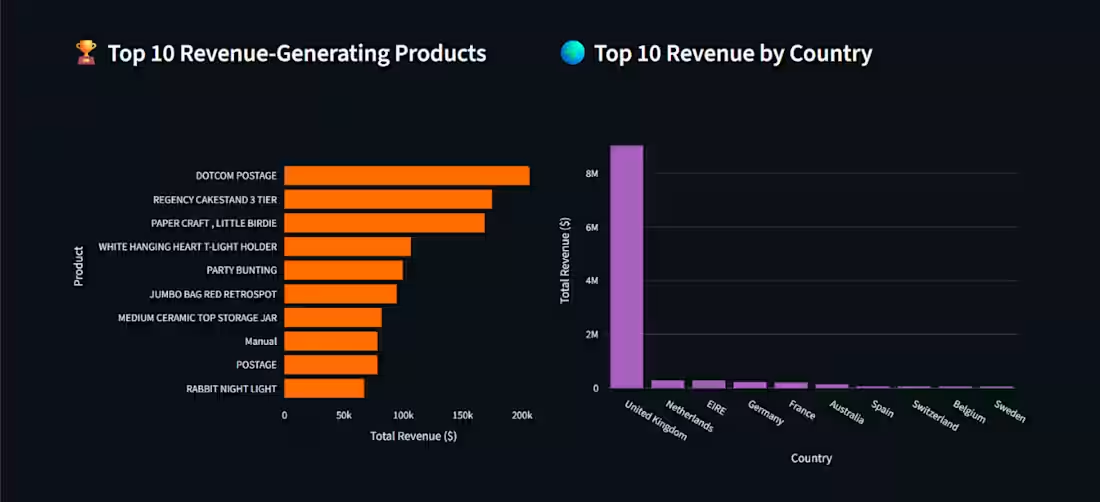
I just engineered and deployed a live Online Retail Executive Dashboard analyzing over $10.6M+ in transaction data.
Role: Data Analyst / BI Engineer
Tools Used: Python, Pandas, NumPy, MySQL, SQLAlchemy, PyMySQL, Streamlit, Plotly, Jupyter Notebook
Project Overview:
Engineered and deployed an interactive executive analytics application designed to process and visualize over $10.6M+ in raw online retail transaction data across 19k+ customer orders. The system automates key performance metric tracking, sales seasonality analysis, peak shopping hour detection, and customer lifetime value (LTV) segmentation.
PNG+ 1
Key Architecture & Execution Steps:
Database Architecture & Management: Structured relational database schemas and executed SQL queries via MySQL, SQLAlchemy, and PyMySQL to handle high-volume retail transactional records efficiently.
Data Pipeline & Transformation: Processed, cleaned, and aggregated raw order histories using Pandas and NumPy, handling missing values and calculating key financial KPIs.
Interactive BI Dashboard (Streamlit & Plotly): Built a responsive web dashboard featuring dynamic Plotly visualizations for monthly seasonality, hourly trend analyses, and top revenue-generating products.
Customer Segmentation & LTV Analysis: Isolated top VIP buyers driving significant revenue chunks to assist marketing and management in customer retention strategy.
Business Impact & Key Insights:
• Revenue Aggregation: Automated real-time tracking across $10.67M total revenue and 19k+ orders.
• Operational Efficiency: Identified peak shopping hours (12:00 PM – 2:00 PM) to inform targeted promotional schedules and server load planning.
• VIP Customer Targeting: Extracted lifetime value metrics to highlight high-value accounts responsible for major revenue share.
0
14
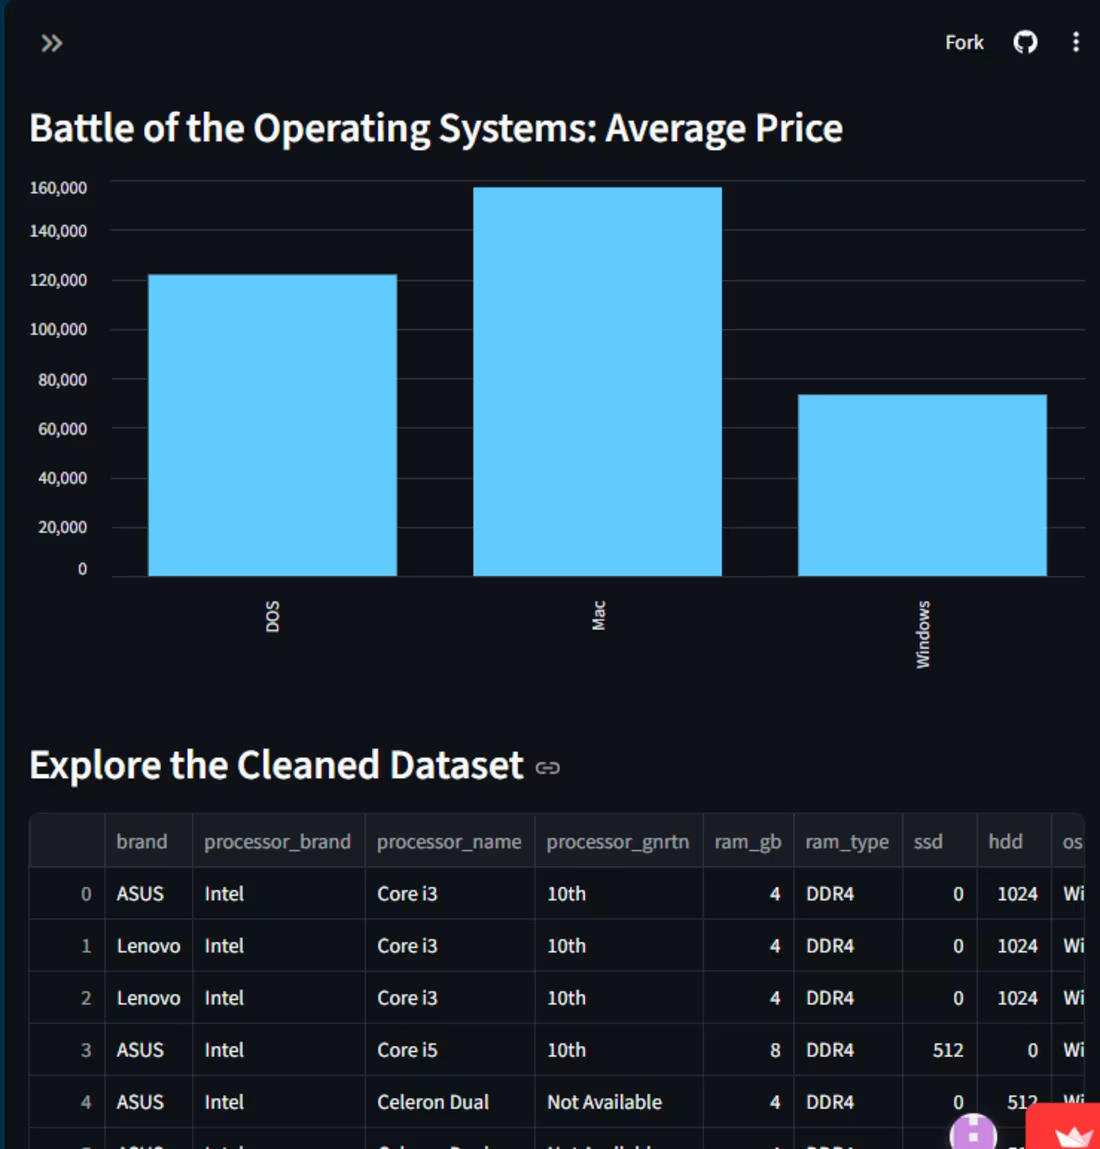
An automated data engineering pipeline and interactive Streamlit dashboard for analyzing laptop market prices and specifications.
Role: Data Analyst / Python Web Developer
Tools Used: Python, Streamlit, Pandas, Data Cleaning, Data Normalization
Project Overview
Transformed a chaotic, uncleaned dataset of laptop technical specifications and market prices into an optimized, interactive analytics tool with automated data quality workflows.
Key Architecture & Execution Steps
1. Data Ingestion & Cleaning: Built automated Pandas routines to parse dirty text, handle structural anomalies, normalize formatting, and resolve missing values.
2. Pipeline Automation: Packaged the cleaning architecture into modular, reusable Python functions.
3. Web Interface & Analytics: Developed a responsive Streamlit UI with dynamic sidebar filters, real-time KPI metrics, and OS price benchmarking charts.
4. Performance & Cloud Deployment: Implemented @st.cache_data for ultra-fast queries and deployed the live app via Streamlit Cloud from GitHub.
0
20
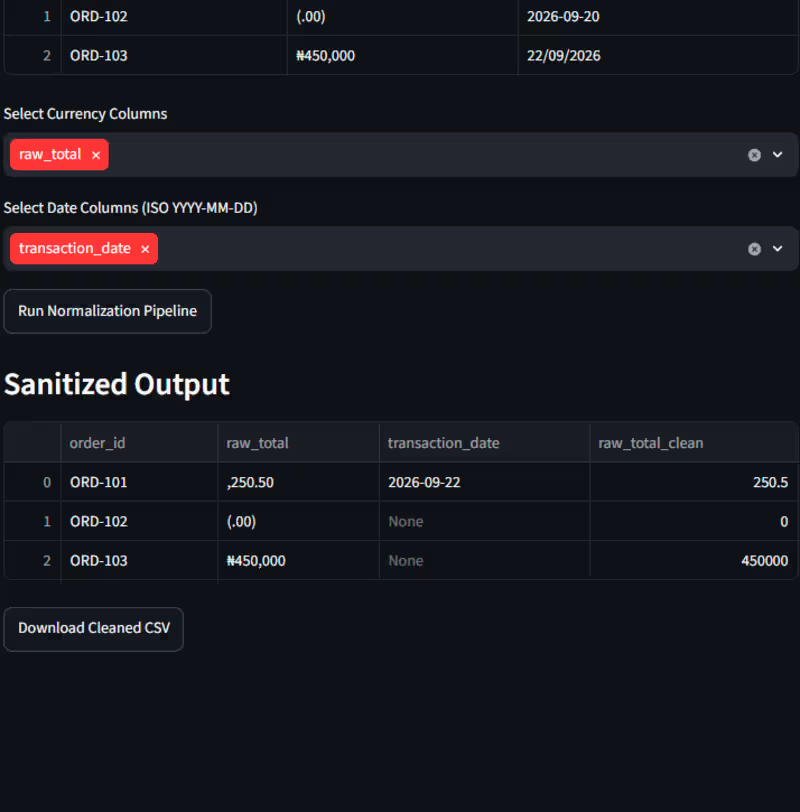
Automated Multi-Currency Data Cleaning & Normalization Web Application
Role: Data Analyst / Python Web Developer
Tools Used: Python, Streamlit, Pandas, Data Cleaning, Data Normalization
Project Overview:
Developed an interactive Python web application using Streamlit that automates the extraction, cleaning, and normalization of raw multi-currency transaction datasets.
Key Architecture & Execution Steps:
Raw Data Ingestion: Uploaded unformatted raw transaction records containing mixed currency symbols (e.g., ₦, ,, (.00)) and dates.
Interactive UI Configuration: Designed custom user dropdowns enabling users to select target currency and date columns for automated processing.
Data Sanitization Engine: Processed dirty strings into clean numeric float values using Pandas regex transformation pipelines (raw_total_clean).
Standardization & Export: Outputted standardized ISO-formatted sanitized data tables with immediate downloadable CSV capabilities.
0
21