
Make.com Level 5 & Zapier Expert: AI and Ops Automation
How do you show a client three website directions on one call without drowning in tabs?
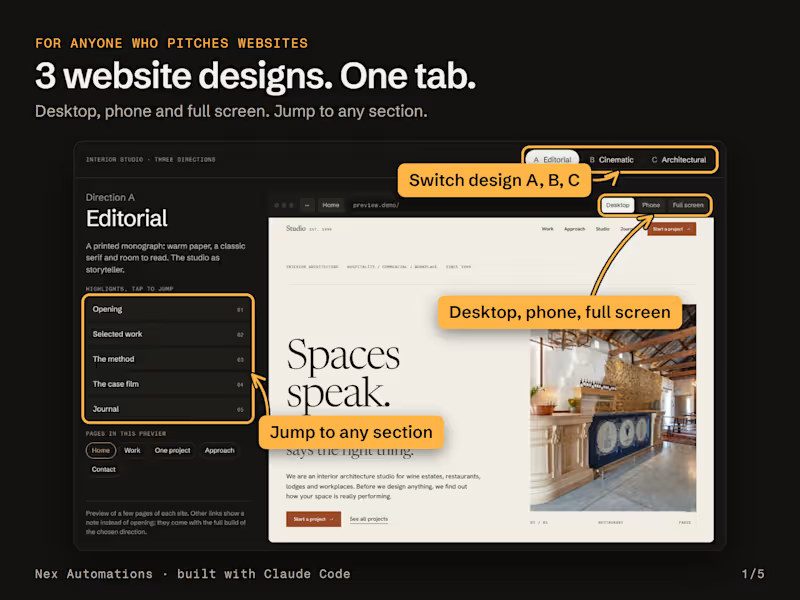
This week we stopped juggling. We built a presenter page with Claude Code and ran the whole call from one tab.
The problem it solves: on a design call you open a tab per concept, resize the window to "show mobile", scroll hunting for the section you meant, and the client loses track of which version is which. The work was fine. The way we showed it wasn't.
What it does, all in one tab:
Direction tabs across the top. The real site runs inside a browser frame, so scrolling, hover states, animations and video all work live.
Desktop or Phone. Phone is a true 390 px view. Desktop renders the real 1440 px layout scaled to fit, so you see the actual design, not a squeezed one.
Full screen in one click, made for screen sharing.
Highlight buttons that jump the site straight to the section you are talking about: the opening, the work grid, the film.
A short page list (home, one project and contact), so the walkthrough has a beginning, middle and end.
The guardrail designers will appreciate: only 4 or 5 pages of each site open. The landing page, one full project and the key pages. Every other link shows "This page comes with the full build" instead of opening. You pitch the real thing without handing over the build before there is an agreement.
It travels too. Packed as a zip, it runs from a double-click with no server and no install, so our partner can run the same demo on his own calls.
Why not just send a staging link? It opens every page, and on a call the client wanders off on their own. This keeps everyone on the same screen.
What I would tell any designer pitching websites: show the site moving. Scroll, hover and motion are exactly what a PDF can't show.
How do you present website concepts today: a PDF, a Figma prototype or a live link?
1
1
122
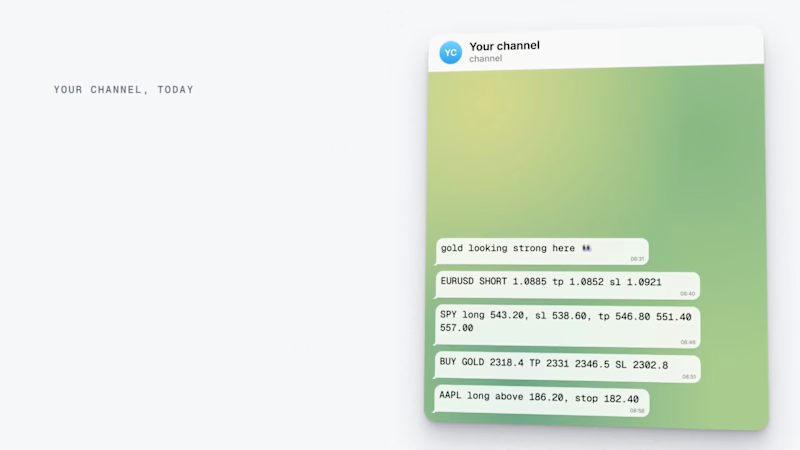
I made launch video for my own new Saas called Tickershare using Claude code. Rate it, share feedback and give me some tips.
2
2
172
Does someone on your team lose a day or two building the sales report every week or month?
That was the starting point at Mokobara, the premium travel brand. Pulling sales across all their stores, checking returns, reconciling the numbers and emailing each manager took 1 to 2 days every cycle, with 8+ hours of that spent just reconciling.
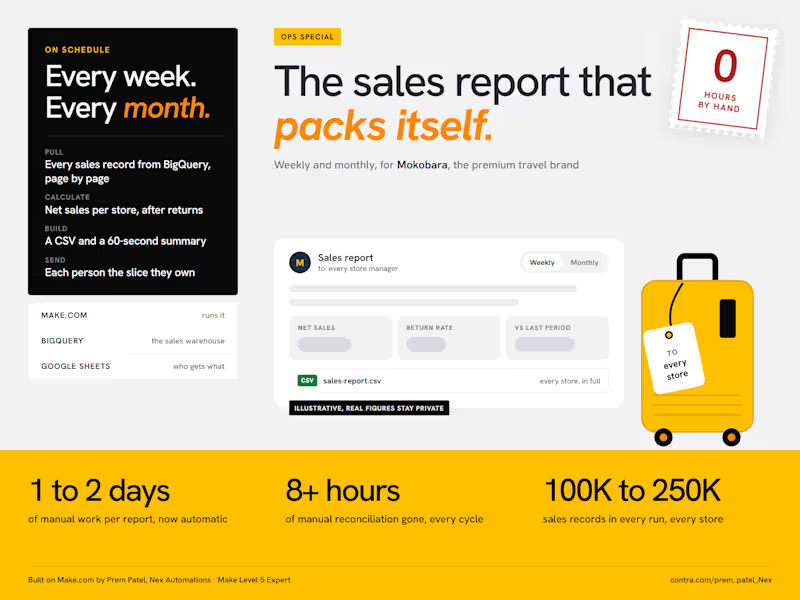
I built them an automation on Make.com (http://Make.com) a few months ago. It has run on its own ever since, weekly and monthly:
Make pulls every sales record from BigQuery, 100K to 250K per cycle. That is too many for one request, so it reads them page by page and stitches them back together.
It calculates the numbers the team actually uses: net sales per store after returns and discounts, return rates and the change against the last period.
It builds a CSV with the full breakdown and a short email summary you can read in 60 seconds.
It reads a Google Sheet of store representatives and emails every one of them the report for their own store.
The result: the reporting problem is gone. The report went from 1 to 2 days of manual work to fully automatic, and the 8+ hours of reconciliation dropped to zero.
Two things I would do the same way again:
Calculate "net sales" in the automation, not in the warehouse. The business rule for what counts as a net sale is not what the raw data stores.
Send people their slice, not the whole report. One report for everyone gets skimmed by everyone.
The figures in the image are placeholders, the real ones stay with the client.
What report is your team still building by hand? Tell me where the data lives and I will tell you how I would automate it.
5
631
