Projects in Gajuvaka
Projects in Gajuvaka
Sign Up
Post a job
Sign Up
Log In
Filters
1
Projects
People
Message
0
Harshavardhan Surisetty
AI-Powered FAQ Widget
0
33
Message
0
Hemal Singh
Cardboard Concept Mobile app
0
9
Message
1
Vijay N
Edited short-form content for Dan Bakery Cafe, focusing on cinematic visuals, smooth transitions, speed ramps, beat synchronization, and engaging storytelling. Created reels designed to showcase the food, atmosphere, and overall brand experience while keeping them optimized for social media.
1
139
Message
0
Srujana Reddy
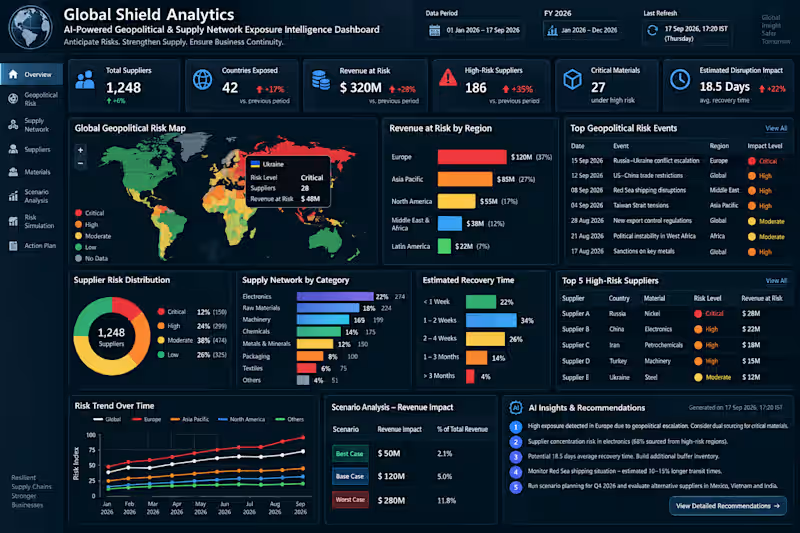
AI-Powered Geopolitical & Supply Network Exposure Intelligence Dashboard Global supply chains are complex. Understanding where your business is exposed shouldn’t be. I designed Global Shield Analytics as an executive-level Power BI solution that connects geopolitical risk, supplier dependency, critical materials, operational disruption, recovery time, and financial exposure in one intelligent reporting environment. Instead of simply showing what happened, the solution is designed to help leadership understand: Where are we exposed? → What could be affected? → What could it cost? → How long could recovery take? → What should we investigate next? What I Can Build for Your Business Every organization has different data, KPIs, reporting processes, and decision-making requirements. I build the Power BI solution around your actual business needs, rather than forcing your data into a generic template. Requirement Discovery I understand your reporting challenges, business objectives, KPIs, stakeholders, existing reports, and required outcomes. Data Preparation I connect, clean, transform, and structure data from sources such as Excel, SQL, ERP, CRM, and other business systems using Power Query. Data Modelling I develop a scalable semantic model with relationships, dimensions, measures, and business logic designed around your reporting requirements. DAX & KPI Development I create the calculations required for your business — financial metrics, operational KPIs, supplier performance, risk indicators, trends, targets, and other decision metrics. Power BI Dashboard Development I transform the prepared data into a professional, interactive dashboard with executive KPIs, drill-down analysis, filters, trends, comparisons, risk views, and actionable insights. Business Validation I validate the calculations and outputs against the agreed requirements and source data so the final reporting solution is consistent and business-ready. Performance Optimisation I structure and optimise the model and report for better performance, usability, navigation, and scalability. Final Delivery I provide the completed Power BI solution with the agreed reporting structure, visuals, calculations, and handover documentation. 🔗 From Business Requirement to Final Intelligence Requirement → Data → Power Query → Data Model → DAX → KPIs → Dashboard → Validation → Final Delivery Whether your organization needs to replace manual Excel reporting, consolidate fragmented data, improve an existing Power BI environment, or build a new executive BI solution, the dashboard can be designed around the specific problem you need to solve. The Business Value The goal is not to create more charts. The goal is to create a single, clear decision-support layer that helps teams understand complex business exposure faster and focus attention where it matters. Power BI | Microsoft Fabric | SQL | Power Query | DAX | Data Modelling | Executive BI 📅 Dashboard Date: 17 September 2026 📊 Reporting Period: 01 January 2026 – 17 September 2026 🔄 Last Refresh: 17 September 2026, 17:20 IST Have a Power BI or Business Intelligence requirement? Share the business problem, reporting challenge, or data requirement. I can design and build the Power BI solution around it — from initial requirements through final delivery.
0
51
Message
0
Ratna Madhuri
Turn raw footage into cinematic magic.
0
102
Message
0
Satyagopal Pakki
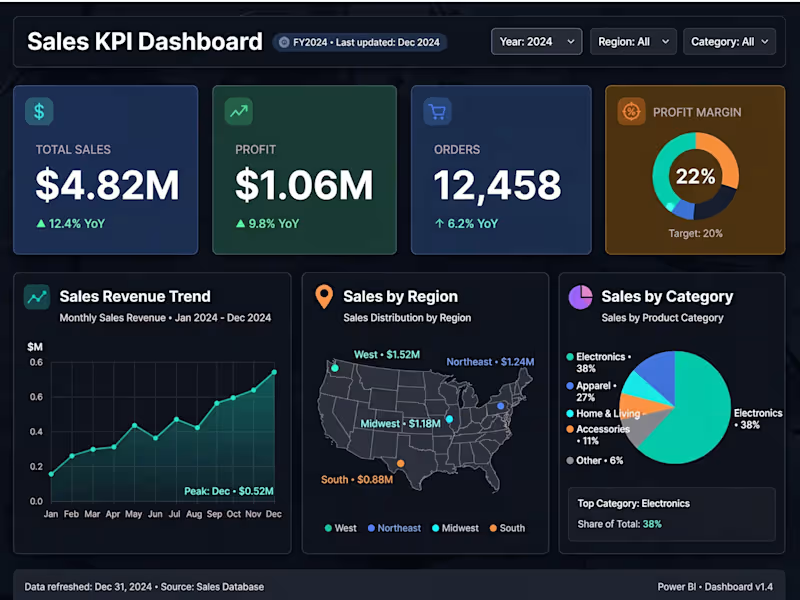
📊 Excel to Power BI Migration | Sales KPI Dashboard | $1.24M Revenue Client was managing everything in Excel sheets - manual & time-consuming. What I Did: ✓ Migrated 5 Excel sheets to Power BI with automated refresh ✓ Built 4 Key KPIs: Revenue $1.24M, Profit $312K, Conversion 4.8%, Active Customers 3,215 ✓ Added YoY growth tracking & monthly trends ✓ Created Region & Product Category breakdowns Tools: Power BI, Power Query, DAX, Excel Result: Client saved 8 hrs/week, now gets live dashboard at 6 AM daily. Used by sales team for daily decisions.
0
65
Message
1
Suresh kumar
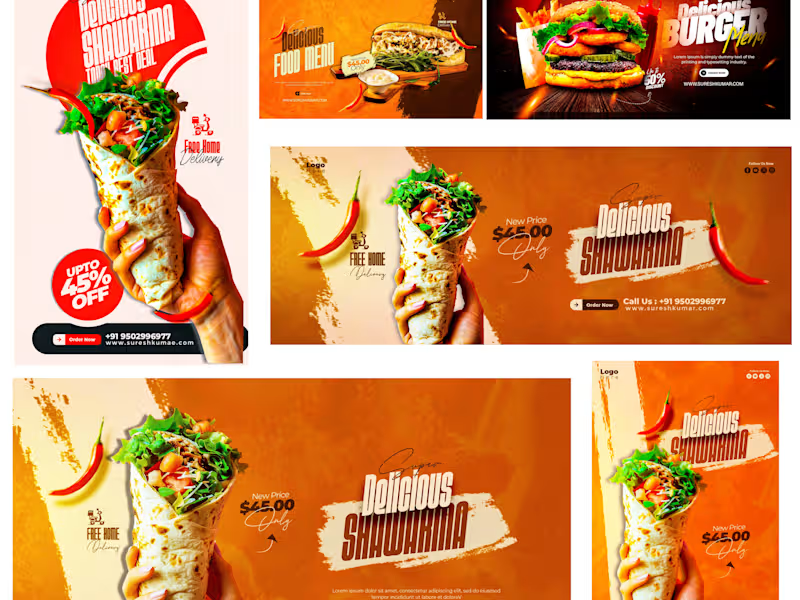
“Delicious Food Social Media Banner Designs”
1
6
Message
0
PRANAV BOGGAVARAPU
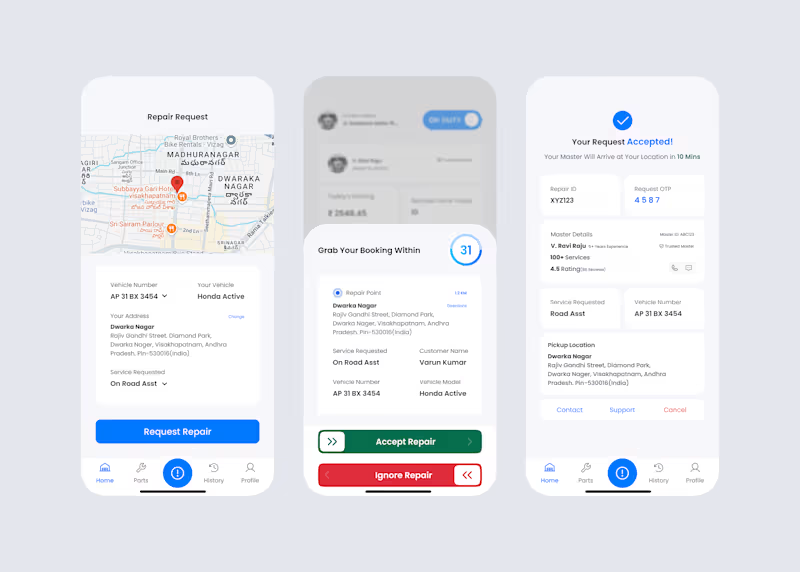
Wecrews –Redefining Automotive Assistance
0
22
Message
0
Satwik Achanta
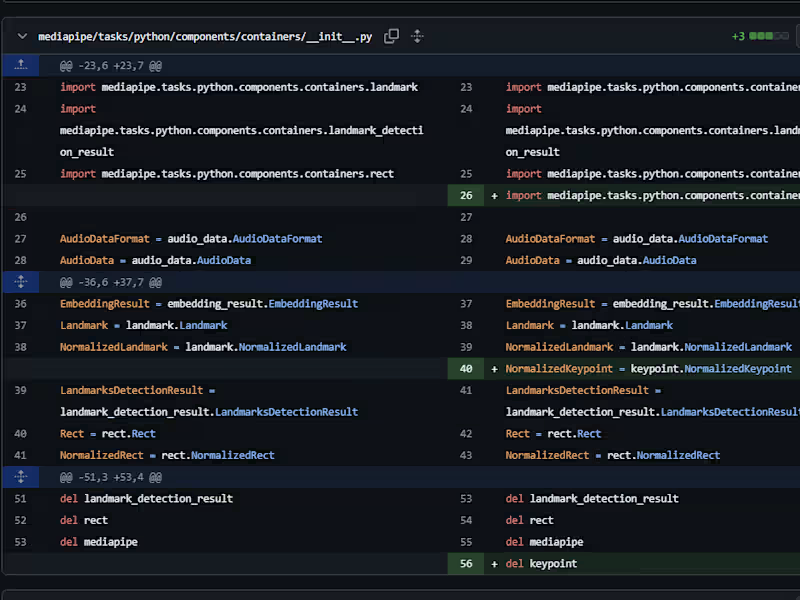
Mediapipe Python API Enhancements
0
7
Message
0
VEDURUVADA SATYA SAYENDRANADH
Study Progress Tracker Application Development
0
4
Message
1
Meghana Patnala
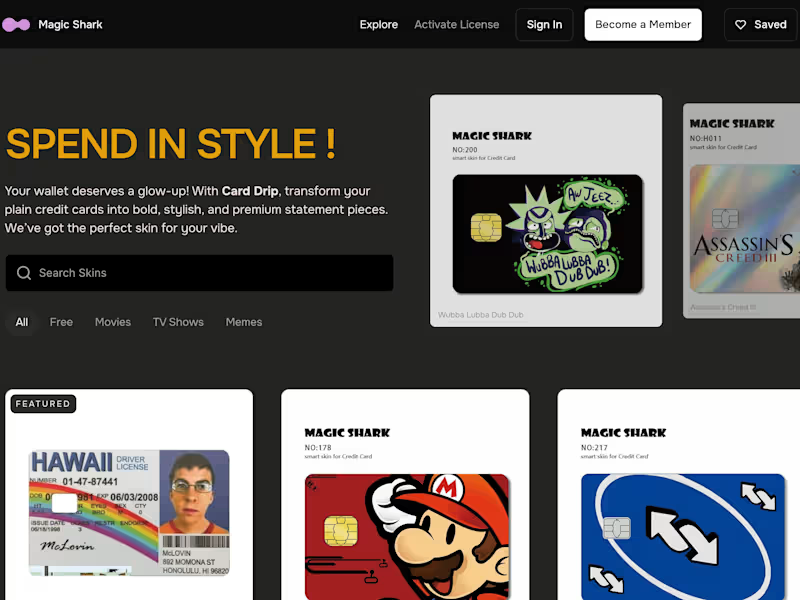
A multi page framer website for a credit card skin company
1
11
Message
0
Revanth Sai
Gen AI | Framer template
0
4
Message
0
Nandu Edits
AD Funnel Edit
0
26
Message
0
DIVYA GOWRI PENTAKOTA
Project: Creating an Interactive Prototype for a Web Application
0
6
Message
0
Murthy Kolla
Financial Analysis for XYZ Corporation
0
41
Message
0
Yeshwanth Gopal Jaladi
3D Models
0
4
Explore projects