The network for creativity
Join 1.25M professional creatives like you
Connect with clients, get discovered, and run your business 100% commission-free
Creatives on Contra have earned over $150M and we are just getting started
Back to feedPost
Visualizing data helps build stories. Below, I visualized the financial statements I received from a client. I added an analysis portion at the bottom of each chart that questions the user's behavior & allows users to reflect on their spending.
For example, a large portion of this user's discretionary spending was on dining out. The user recognized that dining out made a big portion of the pie chart. Additionally, the dashboard asked the user if dining 16 times during the month was a surprise to the them. Most individuals don't know how much they spend each month and this was a reality check for the user. Through analysis & visualization, the user has a better understanding of their financial situation & began better spending habits.
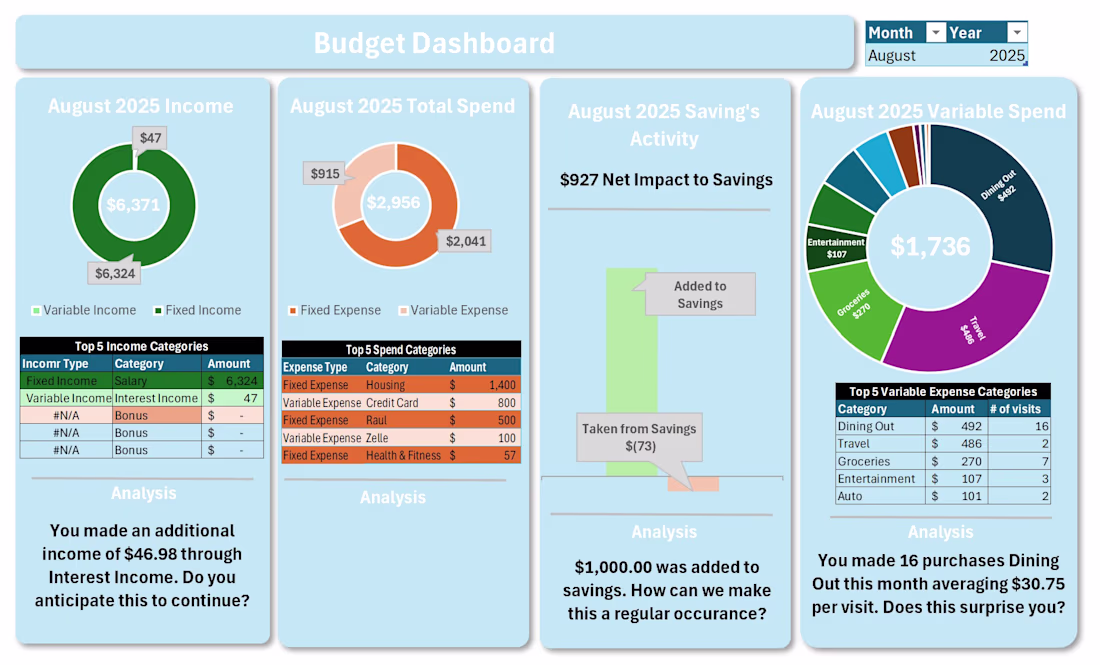
This is a great example of how dashboards should guide thinking, not just show numbers. Adding reflective questions turns data into behavior change — that’s where real value is created.
The network for creativity
Join 1.25M professional creatives like you
Connect with clients, get discovered, and run your business 100% commission-free
Creatives on Contra have earned over $150M and we are just getting started
Related posts
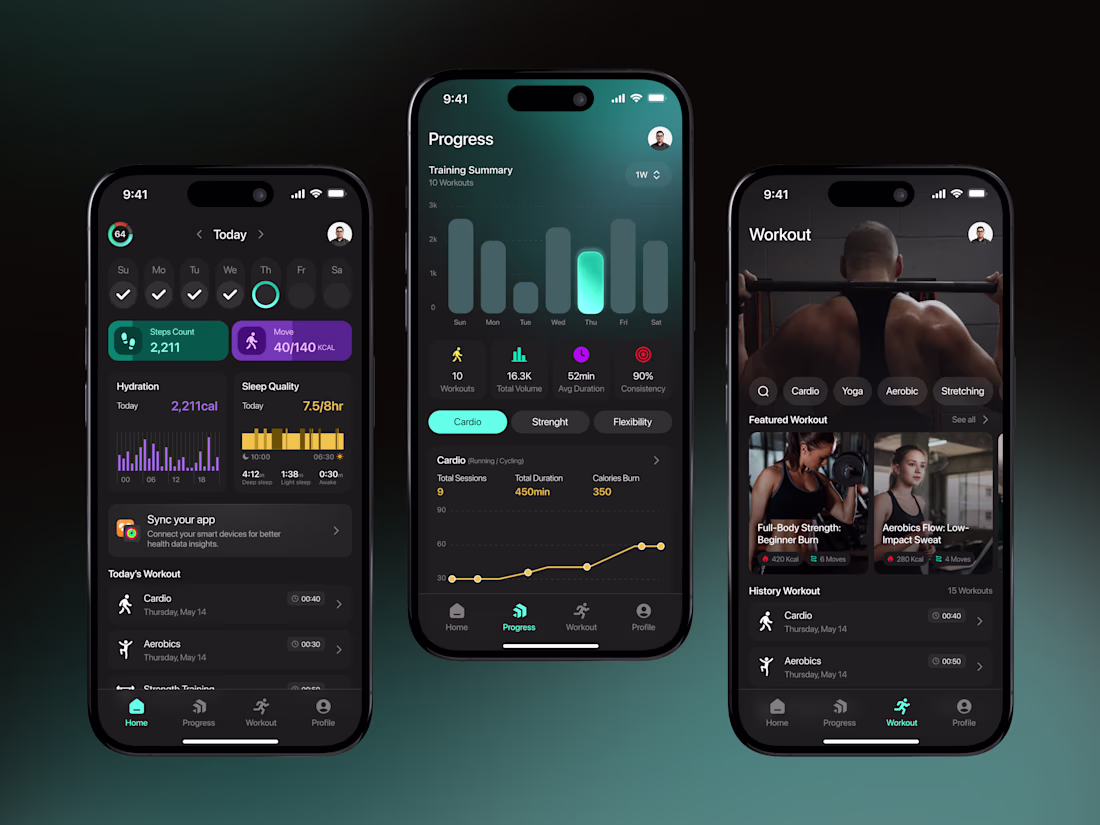
A modern fitness tracker mobile app UI designed to help users monitor workouts, track daily activity, and visualize progress in a clean and motivating experience.Focused on health insights, workout tracking, and intuitive data visualization with a sleek dark interface built for better engagement and consistency.
📩 Collaborate with Us? Contra Cansaas Agency
Nice work!
People don’t stop for content anymore they stop for connection.
This concept was designed around the idea of global digital interaction, where technology, communication, and human presence feel emotionally connected instead of cold.
Create a social-first visual that feels futuristic without losing the human element.
Hyper-realistic storytelling, bold neon contrast, immersive lighting, and a composition built to instantly capture attention in crowded feeds.
A high-impact visual identity that feels modern, premium, and impossible to scroll past.
Designing for attention is easy. Designing for emotion is what makes people remember.

Great work!
Trending
Claude
Claude has entered the design space. How are you using Claude Design?
Contra University
Learn from expert creatives how to earn more using next-gen AI tools.
creativeaiflow
Creative AI workflows are evolving. What tools do you use, and what are their strengths and weaknesses?
portfolioreview
The best portfolios tell a story, not just show a grid. Share yours for feedback.
freelancerlife
Freelancer life is wins, pivots, and everything in between. What’s yours right now?